Timothy Farewell1, Peter Friend2 & Martin Whiteley3 explore new digital mapping techniques in the flat-lands of Eastern England.
Geologists living and working in the subtle landscapes of the eastern counties of England are used to geological mapping that is based on rare outcrops of bedrock, linked by very low regional dips and layer-cake stratigraphy. We three authors all work in this area and have become convinced that systematic detailed analysis of landscape topography can add new and powerful tools in research and also provide a key to much better general public understanding. Some initial studies of this approach were used in recent New Naturalist books by one of our number - Peter Friend
1,2.
We are all three involved in local research and geoconservation work, and decided to test these ideas by compiling maps using widely available digital data for the adjoining counties of Bedfordshire and Cambridgeshire. Support was provided by a small grant from Natural England that was administered with the help of Geo-East, an informal association of organisations in the six counties of Bedfordshire,
Cambridgeshire, Essex, Hertfordshire, Norfolk and Suffolk. A version of our report was produced for various websites within the Geo-East network
3, but this article is the first ‘published on paper’ account of our work.
We have selected six maps, at two different scales, to illustrate the types of visualisation we have been testing. Using ESRI’s ArcGIS Geographical Information System software, we have overlain 1:50,000 scale geology mapping (British Geological Survey, 2011) and 1:250,000 scale soil mapping (National Soil
Resources Institute, 2011) on a hill-shaded digital terrain model (DTM) derived from the Ordnance Survey Opendata Panorama dataset. This combination of datasets has allowed intuitive visualisation and discussion of the relationships between landscapes, geology and soils.
INTERPRETATION
Fig. 1: Regional topography of Bedfordshire, Cambridgeshire and Milton Keynes
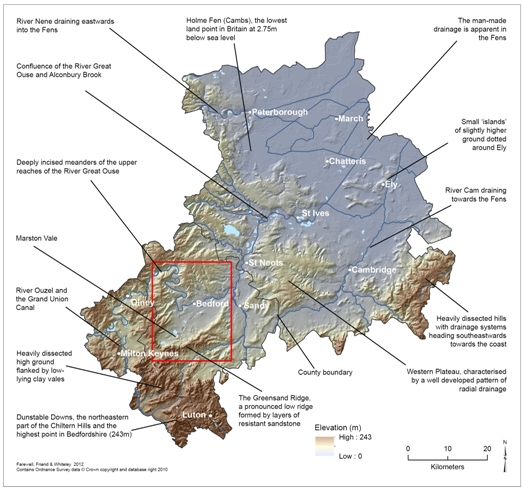 Figure 1 covers the counties of Bedfordshire (in the SW) and Cambridgeshire (in the NE), plus the Borough of Milton Keynes. The long dimension (from SW to NE) of the area mapped is about 100 km. The map presents an elevation model in metres with a vertical exaggeration of 20, using elevation colouring and hill-shading to pick out major topographic features. We draw attention to some of these features using flag-labels and the red rectangle around Bedford locates the area represented in Figures 4-6.
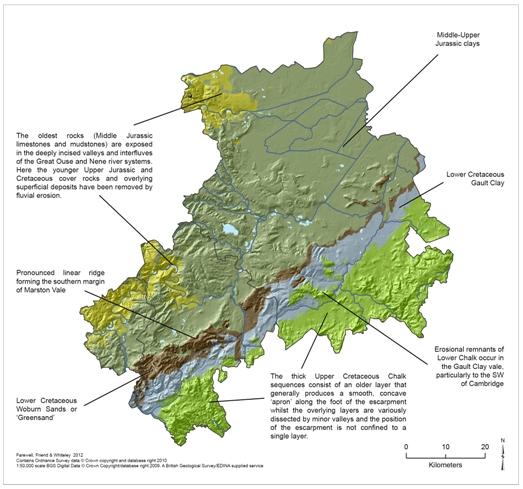
Fig. 2: Regional bedrock geology of Bedfordshire, Cambridgeshire and Milton Keynes
Figure 2 covers the same area and uses the same elevation portrayal, but with the addition of a layer representing bedrock geology. This extra layer involved some merging and rationalisation of data to provide consistent coverage across the two counties. The map shows the SW-NE trend of the bedrock units that is typical of this region of England. Flag-labels identify different stratigraphic units of Jurassic and Cretaceous age that underlie superficial deposits and are normally obscured at the surface. Notice that most of the topographic features of the landscape do not correspond closely, on this scale, to the trend of the bedrock units, except where the Chalk hills provide the highest elevations along the SE boundaries of both counties. Other approaches are obviously required to shed light on what has influenced the local landscape.
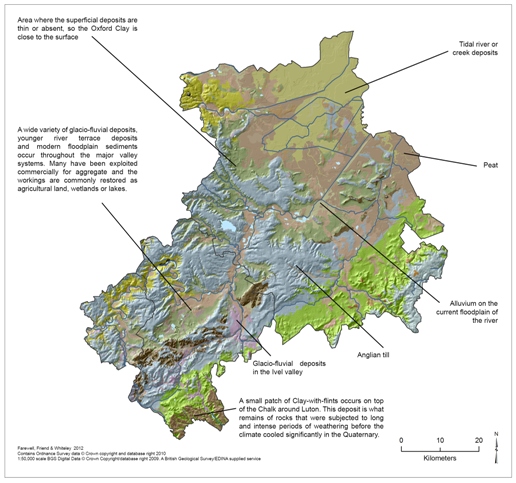
Fig. 3: Regional surface deposits of Bedfordshire, Cambridgeshire and Milton Keynes
Figure 3 is similar to Figure 2, except that an additional layer of shading represents surface (or superficial) geological deposits, essentially of Quaternary age. Surface deposits obscure most of the underlying bedrock, with the silty and peaty Fen deposits in the NE showing up particularly clearly, as does a widespread capping of glacial till on areas of higher ground. This till is a clay- and pebble-rich deposit, formed by deposition from ice sheets. There is disagreement4,5 about the correlation of tills of Mid Pleistocene age across the Eastern Counties, and all agree that more local work is needed. Meanwhile we simplify our overview by accepting that the local till was deposited during the Anglian Stage (Marine Isotope Stage 12) and estimating that this took place between 480 and 425Ka.
The till is now preserved only on the higher hills and plateaux where it has not been removed by river and slope erosion. This distribution provides time constraints that help in the understanding of landscape evolution because it generally shows a much closer correspondence with topography than does the pattern of the bedrock units.
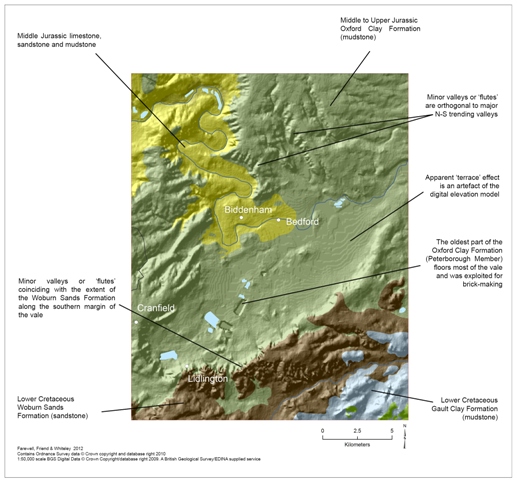
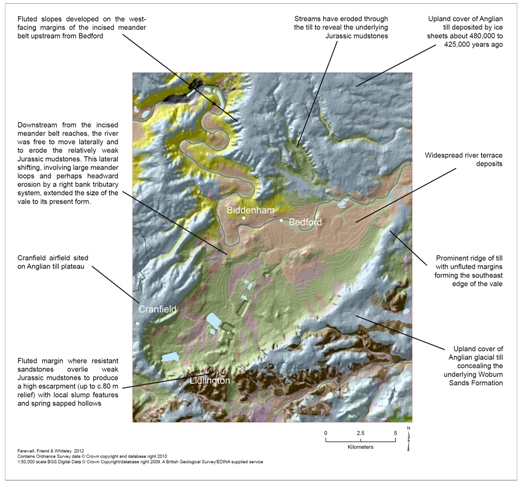
Fig. 4: Local bedrock geology of the Bedford area
The remaining three maps (Figures 4-6) illustrate the local area centred on the town of Bedford as outlined on Figure 1. The map boundary represents an area 25km from north to south, and 20km west to east.
We focus on Marston Vale, a remarkably large and relatively flat-floored landform with an average elevation of about 30m above sea-level. It has a pronounced elliptical form (the ‘Bedford Bite’1) that is elongated SW-NE. The River Great Ouse enters the Vale from the NW, emerging from a highly meandering upstream valley that is incised into Middle Jurassic bedrock, much of which is limestone. After flowing through Bedford, the Great Ouse flows NE towards the sea.
The hills to the NW of Marston Vale have been eroded in Upper Jurassic mudstones, mainly the Oxford Clay. On the floor of the Vale, numerous old pits that exploited the lower horizons of the Oxford Clay for brick-making have left their mark, and obliterate any original drainage patterns. The southern and SE margins of Marston Vale are particularly clearly defined and rise 60-100m above the floor; here they have been eroded in relatively resistant Lower Cretaceous sandstone (Woburn Sands Formation or ‘Greensand’). The marginal slopes of the Vale are either smooth or locally distinctly ‘fluted’. We believe that this reflects contrasts in the slope failure patterns due to differences in the local geological materials.
Fig. 5: Local surface deposits of the Bedford area
 The most important feature shown on Figure 5 is the extensive cover of most of the higher ground by glacial till, known locally as the Oadby Till, and considered to be Mid Pleistocene in age (see above). It is difficult to avoid the conclusion that the whole of Marston Vale has been created by erosion of parts of a continuous sheet of this glacial deposit, and that this erosion must have happened since the melting of the Anglian ice sheet.
The ‘fluted’ margins in the south of the Vale, where the layers of bedrock have slumped and been incised by small streams, have formed under a range of post-Anglian climates that include very prolonged and repetitive spells of periglacial conditions. So too have the closely-spaced ‘flutes’ to the north of the River Great Ouse, although they have formed in the clay-rich till.
DENUDATION
It is not easy to evaluate the relative importance of fluvial erosion by a highly mobile River Great Ouse, no longer constrained within its upstream meander belt, and slope-generated erosion under conditions of periglacial ground mobilisation. Our current thinking is that both contributed substantially to the evolution of Marston Vale. Slope retreat due to repeated freeze-thaw cycles, along with the development of thaw-lakes, would have initiated landscape lowering. Efficient removal of the mobilised and slumped material must have depended on the ancestral River Great Ouse. Our conclusion that Marston Vale is primarily a Quaternary landscape feature implies high rates of denudation, an observation that has wider implications because similar processes are likely to have been active together in other parts of eastern England, such as the Fens.
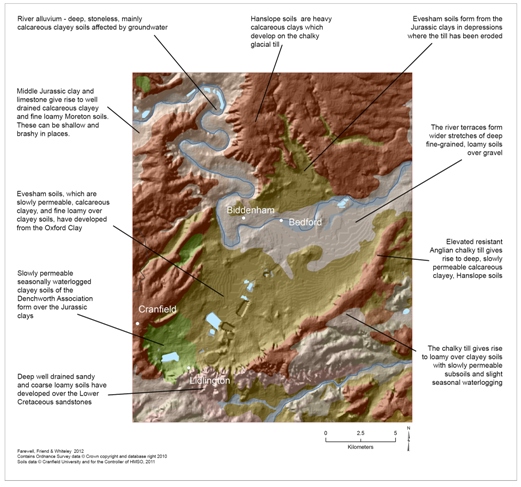
Fig. 6: Local soils of the Bedford area
It is well established that soil development is a function of climate, relief, parent material (geology), organisms, and time6. In the context of Marston Vale we see relief and parent material (which are themselves often linked) as the dominant local drivers for the differences in types and properties between the soils (Figure 6).
The soils dataset (NSRI, 2011) used in this map have been overlain on the same hill-shaded digital terrain model used previously. Displayed here are different soil associations (e.g. Evesham, Hanslope, Denchworth & Moreton), which are groupings of taxonomic soil series7 commonly found in association with each other in the landscape. Over 700 soil series have been mapped in England and Wales. These are differentiated on the basis of their drainage characteristics, texture (% sand, silt, clay, organic matter) and parent material. Within Marston Vale heavy, poorly-drained soils form on clay-rich substrates, regardless of whether they are Jurassic or Pleistocene in age. In contrast, better-drained loamy soils characterise areas that are underlain by porous bedrock or fluvial sands and gravels.
RATES OF CHANGE
Long gone are the days when people viewed landscapes as permanent features of a non-evolving Earth. We all now accept that landscapes change. The advantage of our detailed map-based approach is that it helps us to understand better the interaction of the different processes that have fashioned those changes.
The area of Figures 1 to 3 provides a sample of part of the SW-NE trending scarp-and-vale topography that is typical of central and eastern England. The gentle, overall tilting of the Jurassic and Cretaceous strata that underpin this topography has occurred during Cenozic times, the last 65 million years. The extent to which this crustal movement has been caused by thermal doming of NW or Western Britain early in the Cenozoic, or erosional isostasy is debatable. They resulted in the complete removal of some 300m of Upper Cretaceous Chalk from the Bedford area (Figs. 4-6), suggesting an average denudation rate of 300m over 65 million years or about half a centimetre per thousand years. The removal of the Chalk revealed the underlying rocks, with their different weathering characteristics: weak (Gault and Jurassic) clays formed low-lying vales separated by a more resistant (Woburn) sandstone scarp. Where remnants of the once continuous Chalk cover remain further south, they too form a prominent scarp feature.
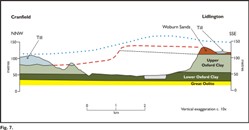
Fig. 7: Cross-section through the western end of Marston Vale. The red dashed line represents the conjectural Cenozoic landscape that influenced the form and thickness of the Anglian till cover (blue dotted line), now mainly eroded away
A cross-section through the western end of Marston Vale, in the Bedford area, along with some conjectural reconstructed surfaces (Figure 7), illustrates how the Vale may have formed. It is clear from detailed mapping8 that the pre-glacial landscape contained significant topography that would have influenced the thickness of the till that was later deposited over it9. When the till was deposited across the area now occupied by the Vale, an escarpment capped by the Woburn Sands is likely to have caused a thinning of the till cover in that area. Soon after the ice sheet vanished, erosion would have tended to remove the till, re-exposing the Woburn Sands escarpment and perhaps localising the course of the ancestral River Great Ouse as it flowed eastwards towards the sea.
TERRACE GRAVELS
Preserved in a meander loop some three kilometres upstream from Bedford, the Biddenham Member is the oldest river terrace deposit, the first relict of the ancestral River Great Ouse. It is considered to be of Marine Isotope Stages 9 age10,11 and probably represents several phases of sediment aggradation under fluctuating fluvial conditions. On this basis, the terrace gravels formed c. 320Ka and were deposited directly on Jurassic rocks, indicating that at Biddenham the cover of Anglian till had been completely eroded away before the terrace formed. Elsewhere in Bedfordshire preserved thicknesses of till usually exceed 30m so it is not unreasonable to suggest that >20 m of till was eroded away during a very short time period (ca.105-160 Ka) immediately following Anglian de-glaciation.
Although denudation rates averaged over uncertain periods of time have to be treated with caution, our estimate is that the initial excavation of Marston Vale began with very high denudation rates (or about 13-19 centimetres every thousand years) under predominantly periglacial conditions and localised seasonal surface drainage. Many other river terrace systems throughout north-west Europe have been attributed to similarly high ‘uplift rates’12.
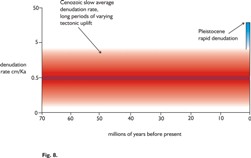
Fig. 8: Diagram comparing denudation rates over long (and uncertain) time periods during the Cenozoic with order-of-magnitude-higher local rates in Marston Vale during the Pleistocene
Our observations suggest there were marked contrasts in the denudation rates that prevailed during the Cenozoic generally and the Pleistocene in eastern England (Figure 8). The remarkable efficiency of Pleistocene periglacial processes13 had a major role in removing Anglian till to reveal an exhumed landscape, though we feel that the speed of this suggests climate change modification of surface processes more than tectonic movement. In the Bedford area, the River Great Ouse acted as an efficient remover of newly eroded sediment and Marston Vale was carved out very rapidly during Mid Pleistocene times.
Using map-based data of many types has provided us with new perspectives on the evolution of this remarkable landscape.
Authors
1. National Soil Resources Institute, Department of Environmental Science and Technology, School of Applied Sciences, Bullock Building, Cranfield University, Cranfield, Bedfordshire MK43 0AL; 2. Friends of the Sedgwick Museum, Department of Earth Sciences, University of Cambridge, Downing Street, Cambridge CB2 3EQ; 3. Bedfordshire Geology Group, Bedford Museum, Castle Lane, Bedford MK40 3XD
References
- Friend, P F 2008 Southern England: Looking at the Natural Landscapes. The New Naturalist Library 108, HarperCollins, London 414pp
- Friend, P F 2012 Scotland: Looking at the Natural Landscapes. The New Naturalist Library 119, HarperCollins, London 466pp
- Farewell, T S, Friend, P F, Whiteley, M J & Zawadzka, J 2011 The mapping of landscapes, geology and soils of Bedfordshire & Cambridgeshire. Available via wwwgeo-eastorguk/publicationshtm
- Lee, J R, Rose, J, Hamblin, R J O, Moorlock, B S P, Riding, J B, Phillips, E, Barendregt, R W & Candy, I 2011 The Glacial History of the British Isles during the Early and Middle Pleistocene: Implications for the long-term development of the British Ice Sheet. Developments in Quaternary Science, 15, 59-74
- Gibbard, P L & Clark, C D 2011 Pleistocene Glaciation Limits in Great Britain. Developments in Quaternary Science, 15, 75-93
- Jenny, H 1941 Factors of soil formation - A system of quantitative pedology McGraw-Hill, New York 281pp
- Clayden, B & Hollis, J M 1984 Criteria for differentiating soil series. Soil Survey of England and Wales - Technical Monograph 17, Harpenden
- Barron, A J M, Sumbler, M G, Morigi, A N, Reeves, H J, Benham, A J, Entwisle, D C & Gale, I N 2010 Geology of the Bedford district – a brief explanation of the geological map, Sheet 203. Explanation of the British Geological Survey, 1:50 000 Sheet 203, (England and Wales). B&B Press Ltd, Rotherham
- Horton, A 1970 The drift sequence and subglacial topography in parts of the Ouse and Nene basin. Report 70/9, Institute of Geological Sciences, Natural Environmental Council
- Harding, P, Bridgland, D R, Keen, D H & Rogerson, R J 1991 A Palaeolithic site rediscovered at Biddenham, Bedfordshire. Bedfordshire Archaeology, 19, 87-90
- Allen, P, Lewis, S, Keen, D H, Shennan, I, Maddy, D & Bridgland, D R Quaternary of East Anglia and the Midlands. Geological Conservation Review, in prep.
- Bridgland, D R 2000 River terrace systems in north-west Europe: an archive of environmental change, uplift and human occupation. Quaternary Science Reviews, 19, 1293-1303
- Ballantyne, CK & Harris, C 1994 The periglaciation of Great Britain. Cambridge University Press 330pp
Maps
British Geological Survey. 2011. Digital Geological Map of Great Britain 1:50 000 scale (DiGMapGB-50), Version 2.11 ed., British Geological Survey, Keyworth, Nottingham.
National Soil Research Institute. 2011. The Digital National Soil Map – NATMAPvector. Cranfield University, Cranfield, Bedfordshire.