This letter, to Dr Benny Peiser of GWPF, has been reproduced here by agreement. It was revised after initial submission on March 4. Editor
Dear Dr Peiser, Thank you for the opportunity to respond to the critique by Drs Carter and Courtillot of my note of 14/2/13 on “The Geological Perspective of Global Warming”. I initially wrote to you to draw attention to Geological Society of London’s statement on this topic, because the geological perspective is usually overlooked in discussions about climate change, and it should not be. But, because Drs Carter and Courtillot moved the debate out of just the geological arena, I am responding in my own capacity, not as a representative of the GSL.
Drs Carter and Courtillot took exception to my use of the phrase “The cooling [of the past 50 million years] was directly associated with a decline in the amount of CO2 in the atmosphere”, saying that correlation was not causation. True. What I should have said was “The cooling of the past 50 million years was driven by a decline in CO2 in the atmosphere.” Prior to the Ice Age of the last 2.6 million years the amount of CO2 in the atmosphere resulted from the interplay between the emission of CO2 by volcanoes and its absorption by the weathering of rocks, especially in mountainous areas, as well as by sequestration in sediments. Methods to determine the likely concentration of CO2 in the atmosphere in the geological past have improved in recent years. They include the numbers of pores (stomata) on leaves, the abundance of the mineral nahcolite (stable above concentrations of 1000 ppm CO2), and the carbon isotopic composition of alkenones from marine plankton. Methods for determining global temperature through time have also improved. We now know that the Eocene was a time of greater volcanic output of CO2, and that the rise of major mountain chains after that time pulled CO2 out of the atmosphere. Geochemical models of the carbon cycle simulate the decline in CO2 after the middle Eocene. Convergence between the CO2 data and the output from those models provide confidence that we understand the process. There is no geologically plausible alternative. We are not talking about a loose association where there is uncertainty about cause as Drs Carter and Courtillot imply. Indeed, even Drs Carter and Courtillot accept that CO2 is a greenhouse gas, and that accumulation of greenhouse gas in the atmosphere warms it. Likewise, its loss will cool the atmosphere.
Besides that, the GSL statement regards the massive injection of carbon into the atmosphere that took place over a short period 55 million years ago, raising temperature, raising sea level, and causing ocean acidity, as a case history that we can draw upon to tell us what may happen in the future if we continue to pump CO2 into the atmosphere at rapid rates. It was not alone; there was another such event in the Toarcian, for example, some 180 million years ago.
Moving on to the Ice Age of the past 2.6 million years, by this time the levels of CO2 in the atmosphere were so low that other drivers of the climate system had more effect. The primary drivers of change in the Ice Age were the tiny changes in solar radiation received at the Earth’s surface due to regular and predictable changes in the Earth-Sun distance and in the tilt of the Earth’s axis. These made the climate of the Ice Age fluctuate between cold periods – glacials- and warm ones – interglacials – in one of which we now live. The role of CO2 in this system was to provide positive feedback to the rises in temperature that took us from glacials into interglacials. In this narrow context, Drs Carter and Courtillot are correct – CO2 increased during the interglacials mainly by outgassing from the ocean. But that was not the main source of CO2 during the Cenozoic era.
We should all reflect on the fact that the past 4 interglacials were warmer than today, and sea levels then were higher than today. Drs Carter and Courtillot wonder if we know enough about the behaviour of the climate system during the Ice Age to be confident in our analysis. Yes we do. The uncertainties are minor. Given what we know from the link between CO2 and temperature with time from the geological record, it would be foolish to imagine that if we warm our planet to the same extent as it warmed in previous interglacials, we will not also see similar rises in sea level to those that occurred in them. In any case, waiting until all small uncertainties are resolved is not a reasonable option.
Our geological knowledge of past climate change is independent of the numerical models used by climatologists to tell us what may happen if we add more CO2 to the atmosphere. The geological data, recalibrated in 2012 by the PALAEOSENS team led by Eelco Rohling (Nature 491, 683-691, 29 November 2012), tell us that the sensitivity of the climate in the past to a doubling of CO2 was 2.2-4.8°C, about the same as calculated for the modern climate by the climate modellers who feed data to the IPCC. This match is unlikely to be a coincidence. Indeed, it suggests that the climate modellers may well be on the right track, and that Dr Lindzen and others may be wrong in suggesting that the sensitivity is 1°C or less. However, Drs Carter and Courtillot are right to point out that some recent studies suggest that the climate sensitivity to a doubling of CO2 may be closer to the low than to the high end of the IPCC range. While that may appear comforting, it only postpones the inevitable.
Drs Carter and Courtillot took me to task over the relationship between CO2, temperature and sea level. However, their sea level calculations are simplistic. The 20 cm rise that we have seen since 1900 is not an equilibrium response – it is instead a transient response to a rise in temperature of 0.8°C occasioned by a rise in CO2 of 40%, or 100 ppm. The sea level will go on rising even if we stop putting CO2 into the atmosphere, as the ocean equilibrates with the atmosphere over decades to centuries, and as ice sheets slowly decay. Models suggest that the equilibrium position may be 0.5m/1°C due to thermal expansion alone. Currently thermal expansion accounts for around 1/3 of sea level rise, and glaciers and ice sheets for another 1/3 each. It is not difficult to see how a further rise in CO2 could by 2100 lead to a rise in sea level of perhaps as much as 1.4 m as estimated by Stefan Rahmstorf and colleagues.
Drs Carter and Courtillot took exception to my statement that the Earth should have been cooling over the past 10,000 years. Indeed it should because that’s what we calculate from known phenomena like changes in the Earth-Sun distance and tilt of the Earth’s axis. Other shorter-term changes will of course be superimposed upon that trend. Drs Carter and Courtillot emphasize them by providing a graph of Greenland temperatures, but as they point out those were regional. Even so, that graph too shows underlying cooling for the past 5000 years. The small divergences from the mean on the Greenland graph were caused by short term climate changes like those of the Medieval Warm Period and the cooling of the Little Ice Age, which coincided with the Maunder Minimum in sunspot activity between around 1645 and 1715. Both events seem to have been most intense in the North Atlantic and European region, not globally. There is no evidence that the Medieval Warm Period was warmer than today globally. Nor is there any evidence to suggest that we are now living through a similar event.
Drs Carter and Courtillot would like us to believe that the current rapid global warming event is purely natural. This seems odd given that they also accept that carbon dioxide is a greenhouse gas that warms the lower atmosphere and that a portion of human emissions of CO2 is now accumulating in the atmosphere. Moreover one of their key references (Ring et al 2012) makes it clear that human activity has caused the warming since 1900. All our attempts to relate the post 1970 warming to natural sources of heat have failed. Our burning of fossil fuels is detectable in the atmosphere from a reduction in oxygen as well as from an increase in CO2 and from the carbon isotopic signature typical of the burning source materials. Since the 1970s, warming has been taking place while the suns output has not been increasing. Nobody has yet come up with a better explanation of this recent warming than that it is caused by the known increases in CO2 and related greenhouse gases, much as we might expect from what we know of the effect of CO2 in the climates of the past, and from the basic physics of radiation.
The warming of the recent past up to and including 2012 is shown in the attached graph by Hansen, J., Sato M., and Ruedy, R., 2013 “Global Temperature Update Through 2012” (available from www.columbia.edu/~jeh1). The reader will notice that the rise has not proceeded smoothly, but in a series of steps like the one that started in 2002. It was inaccurate of Drs Carter and Courtillot to suggest that this flat spot started in 1998, which was a prominent El Niño year. During El Niño years, shown in the lower graph, the emission of heat from the Pacific Ocean warms the world. Temperatures drop during the subsequent cool La Niña events. They also drop during volcanic eruptions large enough to eject fine particulates and acid gases into the stratosphere. Thus the 1998 El Niño effect visible in the graph was not the start of a flat step; it was followed by a cooling due to a large La Niña. Other large-scale oscillations within the climate system will also have had an effect, one such being the Interdecadal Pacific Oscillation, which shifted to a positive phase in the 1970s and led to a warmer Pacific. In the 2000s that Oscillation reversed, cooling the Pacific and likely thereby contributing to masking the rise in global temperature (EOS, v.94, No.6, 5 February 2013).
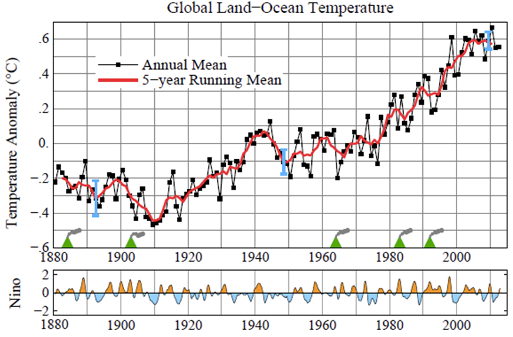
Fig. 1. From Hansen, Sato and Ruedy, 2013. Global surface temperature anomalies relative to 1951-1980. The Nino index is based on the detrended temperature in the Nino 3.4 area in the eastern tropical Pacific. Green triangles mark volcanic eruptions that produced an extensive stratospheric aerosol layer. Blue vertical bars are estimates of the 95% confidence interval for comparisons of nearby years.
In conclusion, I consider that the data from the geological record are consistent with the data from the modern environment, and with projections made on the basis of those modern data as to how our climate may change in the future. Anyone who accepts that CO2 is a greenhouse gas, as Drs Carter and Courtillot do, must expect that a large increase in its concentration is bound to have a warming effect, and observations show a warming that is consistent with this effect. Remarkably few climate scientists dispute that fact. The world is indeed exposed to real short-term climate related events, as Drs Carter and Courtillot point out, but what we face in human-made global warming is an insidious underlying upward trend that will exacerbate those short term events unless action is taken to deal now with the causes of that trend.
C.P.Summerhayes, Scott Polar Research Institute, Cambridge