John Black finds that drawing - using new technology - has not lost its power to aid understanding.
Hydrogeology is not a glamorous sub-discipline of geology, no photos of snow-capped volcanoes oozing glowing lava. It’s a world of log-log diagrams and of conceptual models, many of which bear little visual relationship to what you can see and are somewhat abstract in form. Since leaving the world of large organisations, where some remote draughtsman turned my scribbled impressions into printable diagrams, I’ve had to learn to construct my own diagrams for publication. Whilst this was a chore at first, I eventually realised that the act of drawing was itself giving me insights I might otherwise have missed. In the process, I also developed a few tricks to enhance the impression of 3D that I was often trying to project.
Of course, the last thirty years has involved the progression from hand-drawn to computer-drawn, especially in the realm of diagrams (e.g. ExCel™) but also in the relatively easy production of 3D top topographic representations (e.g. Surfer™). However, many computer-based images benefit from some human manipulation and additions to enhance their message. Also , some result in unforeseen difficulties when used in multiples.
Gaining insight


I work in the field of groundwater in fractured crystalline rocks so most of my examples arise from there. The first example is from the safety case for a deep repository on the edge of the Lake District near Sellafield nuclear factory. The calculations of possible future contamination were based on flow within a ‘vertical slice model’ involving recharge on the hills of the Lake District flowing through a theoretical repository (the PRZ) and discharging eventually towards the sea. Interestingly the section chosen for modelling was far from a straight line and wasn’t shown on a topographic map. Combining its location with a 3D topographic plot shows how it wiggles purposefully from high point to high point in the Lake District hills. With heights vertically exaggerated in the figure, it can be seen how the chosen line runs parallel and close to the deeply incised valley of the River Bleng. In real life, the high heads of the chosen section would ‘bleed-off’ into the adjacent valley but a vertical slice model is impermeable to any off-line influences and maintains its high values of driving head regardless. Hence, one can deduce, just from a straightforward 3D representation, that the high heads in the model are improbable. I have included ‘perspectivised’ labels in order not to disturb the 3D impression of the reader. A version with ‘normal’ labels is included opposite (right) for comparison.
My second example is more schematic. It concerns a tracer experiment performed in fractured granite 300 m below ground in a worked-out iron ore mine in Sweden. Nine different tracers were injected from three vertical boreholes above a cruciform-shaped experimental gallery and collected in ‘catchwater’ sheets attached to the roof and walls. Most of the sheets received no inflow of water but, of those collecting tracer, most had mixtures of different tracers. The initial interpretation foresaw ‘rays’ of tracer spreading out from each injection point in a multitude of potential pathways.
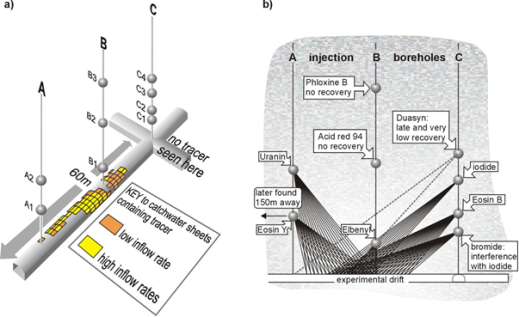
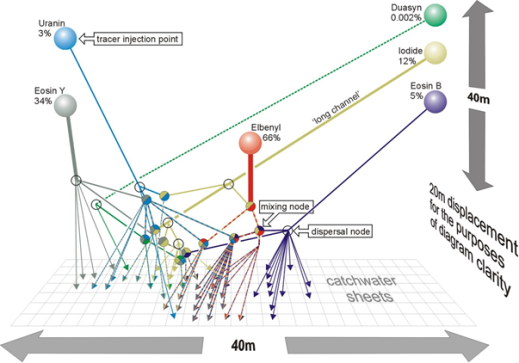
After an initial attempt to redraw the ‘ray diagram’ in colour, I realised that multiple criss-crossing pathways was unlikely and that mixing must occur at a few specific points. Once I tried mixing nodes, it was immediately apparent that the only sensible location for the mixing nodes was close to the experimental drift. Whilst this might seem obvious, a feature associated with this configuration is more important. It is the long pathways, probably channels, that lead from the injection points to the mixing nodes with little off-pathway dispersion. Given the roughly half a metre spacing of the local fractures, the flow in the channels must cross many fracture-to-fracture intersections without bifurcating. I now advocate a ‘long channel’ concept for groundwater flow in fractured crystalline rocks.
3D, perspective and scale
Most people can instantly see when the perspective in a painting isn’t ‘quite right’, usually because some of the included objects have a different viewpoint from others. 3D images drawn by computer normally have a default viewpoint yielding a reasonable 3D image. However, if one places two images with the same viewpoint side-by-side, they clash.

The joint image is transformed if they use the same vanishing point. One of the other effects I have corrected in the second pair of images is the frequent use in many graphics packages of a viewpoint that is close to, and above the subject matter so that the bottom of the subject is noticeably further away than the top. Vertical lines in images of box-like objects become non-vertical. Restoring the verticals is like using a telephoto lens from further away. Both diagrams use boundaries in the form of planes to indicate the limits of the underlying box model and also the planes are translucent and coloured in grey from nearest to farthest away to enhance the sense of distance. Bear in mind that in the rules of ‘colour perspective’ colours become fainter with distance.

The box model images (above) were intended to show how there are a limited number of active flow paths in a sparse channel network and that systems naturally form clusters of similar head value with less permeable links (chokes) between them. At one point, I was considering publication in a journal with prohibitive fees for colour diagrams. I came up with a solution (below) which illustrates a trick with shadows that gives the impression of volume.

Finally, scale.
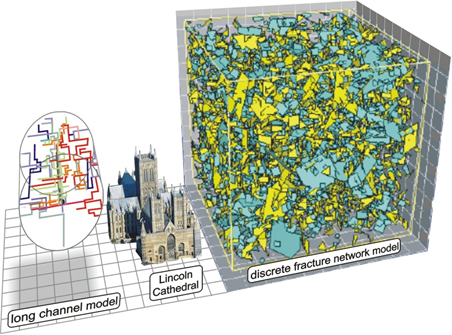
In the abstract world of models, the use of a coin placed in the foreground is of no value. The work providing most of the images here concerns channels enabling groundwater to flow through fractured crystalline rock in a sparse network. The sparseness is important in order to reproduce observed behaviours such as sparse inflows into tunnels and abrupt head jumps in nearby boreholes. In an effort to emphasise how the long channel concept is much sparser than the current approach based on discrete fracture models, I placed two examples of similar rock at similar depth side-by-side. Size is shown in the form of arrows and the difference in density is readily apparent. 
Alternatively, since exact size is not important, a more enlightening indicator of size is shown in a second version. In a way the size of the objects is much more apparent, particularly the chances of hitting an active flow channel if one were contemplating a borehole in such an environment. Lincoln cathedral is 83 m high!
 So, I hope I have sparked a few ideas on how to make hydrogeology , plus some of the other more “unobservable” sub-disciplines of geology more real through a bit of art (fulness).
Author
* John H Black, InSite Hydro E:
[email protected] T: 00 44 (0)1949 21379