
David Nowell* on Italian geological maps, and how ending systematic surveying is the ultimate false economy
While reviewing the 1:1,100,000 geological map of Italy (Geoscientist 22.09, October 2012, p.23), I discovered a wealth of online material related to the work of the Geological Survey of Italy (Servizio Geologico d’Italia), on the website of the Institute for Environmental Protection and Research (ISPRA - Istituto Superiore per la Protezione e la Ricerca Ambientale).
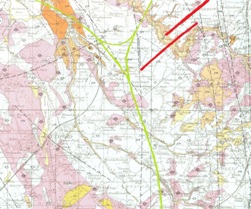
Image: Mount Etna, Sicily to Aeolian islands (Isole Eolie o Lipari), with thrusts marked with barbed red lines and offshore bathymetry, extract from 5th edition 1:1,000,000 Geological map of Italy, Carta Geologica d’Italia 2011 (© Servizio Geologico d'Italia, ISPRA, All rights reserved)
This included a section where many excellent (sadly unpublished) 1:50,000 geological maps may be previewed in a copyright-protected and watermarked zoomable format, alongside 21st Century sheets produced to a very high standard (€13 each) with accompanying booklets. These resemble British Geological Survey sheet explanations, though thicker (well illustrated, up to 208pp), but without the English abstracts seen in the most recent BRGM memoirs for French geological maps at this scale.
 Image: Sheet index for Italian 1:50,000 geological series. (© Servizio Geologico d'Italia, ISPRA, All rights reserved)
While these trifolded sheets, unlike BGS maps, lack a main backfold, the smaller paper size means that, complete with comprehensive keys and cross-sections, they are still extremely practical to handle in the field. Though earlier editions in this modern series are less attractively presented with tricky folding, they are still meticulously surveyed and drafted: only Japanese geological maps, with their incredible wealth of detail, are neater(sometimes complete with lightly superimposed Bouguer gravity contours).
The underlying base-map can be clearly seen beneath the complex line-work, and varied units are drawn together so that you can see both broad-scale features and very fine localised detail. Each 1:50,000 sheet covers about 22x25km in the northernmost Alps, widening to 22x30km in southern Sicily, as they span 20′ east-west by 12′ north-south on a regular degree- based grid. Map and booklet are presented together in a cardboard wallet, including the location and names of the eight surrounding sheets on the front, a numbered index map of Italy on the back, and (if ever completed) a list of all 652 sheets on the inside flaps.
 Image: Regional index for Sicily online, allowing you to click on completed sheets for an enlargeable online preview to beyond the intended 1:50,000 scale (copyright © Servizio Geologico d'Italia, ISPRA, All rights reserved)
All these maps were either drafted or published before systematic geological mapping ground to a halt around a decade ago – this, in a tectonically active country which desperately needs much better planning, with an extraordinary wealth and diversity of historic buildings, landscapes and archaeological remains that require safeguarding. Still, on a national scale the new geological map of Italy now provides a clear regional context coupled with some limited stratigraphically-based translation for English readers in a carefully structured bilingual key. The accompanying booklet contains extensive references.
Closer to home
Even before the current economic crisis, around three fifths of Italy had yet to be surveyed to modern standards when work on the systematic 1:10,000 geological mapping programme underpinning these sheets was halted. This compares to roughly a fifth of Britain’s bedrock, which becomes a third if you include areas with poorly delineated and defined superficial deposits, now that the British Geological Survey has foolishly followed the Italians’ example.
 Basic mapping underpins both informed research and economic planning coupled with sustainable environmental management, requiring objective geologists with a holistic understanding of variations in local ground conditions and mineral resources. Coupled to the added hazards of earthquakes, mountainous terrain and greater risk of flash flooding, this is even more short-sighted in Italy than Britain, where major planning decisions are often undertaken without any geological analysis.
Image: Areas of wet saline rockhead (f 6b Triassic, Lower Keuper Saliferous Beds) below glacial deposits (blue denoting tills and pink for gravels) liable to dissolution and collapse along alternative HS2 route south of Mobberley sketched roughly in green, east of Knutsford, Cheshire, with approximate alignment of Manchester Airport runways (n red), superimposed on Stockport 1:63,360 Solid and Drift edition, 1962 (Bedrock and Superficial) (sheet 98 England and Wales series)
The phrase ‘unforeseen ground conditions’ is often used to cover up expensive mistakes or the failure to undertake cost-benefit analysis of likely ground conditions during construction. So it is unsurprising that the introduction to the initial 2009 report setting out the first phase of the HS2 high speed railway from London to Birmingham and Litchfield junction (to be built with a wider and much higher loading gauge 4•7 m above the rails, compatible with HS1 to the Channel Tunnel and the TGV network, making it possible to operate double-decker trains) states: “the corridor shown does not consider ground conditions” and “Earthworks outlines are based on typical side slopes” (p.15), though: “Outline comments on the materials and geotechnical issues were made based on the digital information provided by the British Geological Society” [sic] (p.9)5,6.
Missing legislation
Thus it is unlikely that HS2 liaised with BGS staff with more detailed knowledge, including access to otherwise confidential third-party borehole data. This, unless it is released by the rights owner, remains forever confidential (thanks to the antediluvian legislation within which BGS operates) as legally, only archaeological remains and borehole records have to be recorded by developers. Once the first preliminary one-inch (1:63,360) survey of an area had been completed, the BGS has no further rights to access, thanks to the way the original 1845 Geological Survey Act of Parliament was drafted, and remains un-amended by subsequent legislation1. The geological survey was envisaged as ‘one-off’ project, and private landowners may refuse access. In a recent geochemical survey of Greater London2 this power to refuse left blank areas around Heathrow Airport, Ford’s Dagenham plant and a private residential estate in Bromley on resulting maps, for all denied BGS permission to take soil samples.
However, a later 2012 report outlining the different options for the proposed route of HS2’s second phase (to Manchester and Leeds) included comments about geology and geohazards based on 1:50,000 BGS datasets, without reference to more detailed geological mapping. Thankfully, the geological information they did acquire was probably enough to rule out the option to the south of Manchester Airport and a few kilometres east of Knutsford, Cheshire, (Stockport 1:63,360 sheet (98) published 1962), sine this “route would be over an area of mudstone with soluble deposits (risk of subsidence from dissolution)”. Notwithstanding the fact that this route runs through George Osborne’s Tatton constituency, its exclusion was therefore probably not due to “blatant political interference”, as assumed by ‘Signal Failures’ (Private Eye, 6 September 2013, No. 1348).
However, because geotechnical issues were downplayed this report could be easily misinterpreted - as it was consequently unclear about how such considerations were weighed during the final selection. In any case, this option was far less attractive: the owners of Manchester Airport vetoed tunnelling under the runway and including a station providing direct interchange with the terminal; while the Greater Manchester councils (who have a controlling interest in East Midlands Airport) were happy to consider tunnelling under that runway along the route of the Leeds spur.
Another illustration of how such assessments are only as good as the quality of the geological mapping on which they are based, is provided by the Environment Agency. It appears to be perfectly content with its groundwater vulnerability (to pollution) maps despite the fact that in places these are based on patchy revisions to Victorian maps, while BGS is developing further products, derived from historic data, that fail to warn users about vast differences in quality/reliability across boundaries with neighbouring areas blessed with 21st Century coverage.
L’Aquila
 Image: Geological map of L’Aquila (1:50,000 sheet 359) published before the 2009 earthquake showing lighter tones indicative of softer ground and widening blue lines to indicate debris flows of unconsolidated material. (© Servizio Geologico d'Italia, ISPRA, All rights reserved)
So in the Italian context it is telling, in the light of the highly controversial L’Aquila earthquake on 6 April 2009, that the introductory paper to a 2012 special issue of the Italian Journal of Geosciences (131.3) insists that high-quality geological fieldwork should always come first when planning for seismic hazards and retrofitting strategies to render existing buildings safer. Authors Daniela Pantosti and Paolo Boncio state bluntly: “it is worth citing, once again, the 1975 everlasting statement by S R Wallace: ‘There is no substitute for the geological map and section – absolutely none. There never was and there never will be. The basic geology still must come first – and if it is wrong, everything that follows will probably be wrong’.”
Though most seismic swarms, like the series of small tremors that preceded the main M6•3 earthquake, simply fade away after some time, sadly this is not always the case. Thus the seismologists who were called in to give public reassurances a few days before the fateful quake should have been more circumspect in their soon-to-be selectively misquoted remarks - especially given the naturally variable ground conditions shown on the 1:50,000 L’Aquila sheet (359, published 2005) and the likelihood that some buildings would have poor earthquake resistance.
 Image: Region around the Bay of Naples and Vesuvius, extract from 5th edition 1:1,000,000 Geological map of Italy, Carta Geologica d’Italia 2011 (copyright © Servizio Geologico d'Italia, ISPRA, All rights reserved)
This can hardly be criminally negligent behaviour, though as events have shown, it was certainly politically unwise for these outsiders to set themselves up as convenient scapegoats when the need arose. Unlike councillors, architects and planners all of whom have local political connections, given that many buildings collapsed with fatal consequences when they might have been expected to be more robust or to have been retrofitted to enhance their earthquake resistance, the seismologists were considered fair game in what amounted to a witch trial and conviction in 2012.
Just to emphasise the significance of local ground conditions; despite the fact that many nearby historic buildings collapsed and a medieval castle suffered considerable damage, the 20 May earthquake (M 6.1) in this Parmesan-producing region mainly killed a handful of guards in the warehouses used to store the expensive 40kg cheese wheels as they mature. These modern structures had been built, without proper foundations, on flatter, softer ground liable to liquefaction.
Maps in limbo
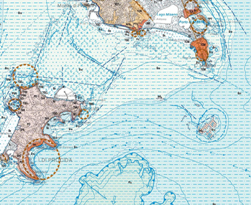 Image: Northwest corner of unpublished Isola di Procida 1:50,000 sheet (465), showing the location of a former vent about 1 km across straddling the island and offshore area near Naples. (© Servizio Geologico d'Italia, ISPRA, All rights reserved)
Still, when it comes to geological data without the constraints of the Ordnance Survey Crown copyright, the Italians (like France’s BRGM) has been able to put its modern 1:50,000 maps online3, via the heading “Geologic cartography”. By clicking through to a series of regional maps (red for published sheets, brown and orange for those that remain unpublished, green for ‘in preparation’ without a live link) you can click on those sheets that have been completed and zoom in, even if earlier, folded editions (rather than flat copies) were scanned.
But, without a budget to print a significant number of fully drafted in-press maps, these remain trapped online and can only be worked on by printing a screen dump of the watermarked page, at whatever enlargement you have selected. This is not the same as dealing with a printed map, as there is often an immense amount of detail to absorb and assimilate. For example, the coastal and offshore geology in the unpublished sheets covering much of the Bay of Naples reveals a great deal about Vesuvius and eruptions of its neighbouring volcanoes and former vents, as it is much easier to image layers produced by major eruptions and related deposits using seismic reflection surveys in these shallow waters.
However, in 2013 at the regional level listing individual sheets, green dots have appeared next to the interactive map alongside many of the activated entries. These link to pdf downloads of “note illustrative”, which are the accompanying booklets with watermarked pages for those with a good internet connection (file sizes can run to tens of Mb when in full colour).
Italy online
Including areas without contemporary 1:50,000 mapping, this is backed up by the seamless coverage provided by the national viewer4 by clicking on the 100k ‘geologica’ layer and zooming in via the scale bar slider at the side of the screen; though at certain regional enlargements switching to the ‘CARG geologica (1:25,000)’ will reveal the numbering of those 1:50,000 sheets, which feature on the other site even if some are inaccessible.
Whichever layer you select, the other key control is via the “Trasparenza” icon in the little box that comes up top right of the screen, allowing you to adjust the transparency of different layers to reveal the aerial photography by toggling a left-right slider while comparing views. Though the instructions are in Italian it is possible to guess a lot of the keywords and simply fly by the seat of your pants: unlike some other viewers I have used, it is no big deal if you crash and need to start again.
 Image: Underwater boundary between late Quaternary Breccia Museo lavas formed of blocky splatter flow scoria (TGC1) and Fiumicello de Procida volcanic tuffs (TFM) off island of Procida from unpublished booklet to go with Isola di Procida 1:50,000 map (sheet 465). (© Servizio Geologico d'Italia, ISPRA, All rights reserved)
Under the main headings come a number of subheadings you can click ‘on’ and ‘off’, including gravity readings and anomalies under ‘Geofisica’, while other examples include ‘Geomorfologia’, illustrating various landforms (apart from ‘Sinkholes’ under a separate heading of its own, ‘Sondaggi profondi’, which shows where deep boreholes are located, and ‘Idrogeologia’ to access hydrological maps at various scales). But even if there is a layer showing maximum forecast ground accelerations within ‘Sismicità storica’ (dealing with seismicity) another layer has hazard mapping conforming to relatively small municipalities - so risk levels change at these boundaries!
Ideally this should be a combination of the largest earthquake likely to occur over a given return period (let’s say a century), deduced from the frequency of smaller tremors over time plotted logarithmically and the likely response of ground conditions either in the epicentre or regional proximity of such rare events. A classic example I was taught was the 5∙4 magnitude earthquake on the Lleyn Peninsula in North Wales in 1984 (roughly a once-in-decade event in Britain), which was not felt much in the northeast of the Principality, but was more widely felt in areas of softer ground alongside the Dee and Mersey estuaries.
False economy
In light of this, with around 60% of a much more dynamic and tectonically active country yet to be geologically surveyed to modern standards, it is only a matter of time before planning relying on outdated information results in a disaster of Aberfan proportions (rather than mere cost-overruns in construction). Then, the Italian authorities will doubtless be tempted to round up some hapless geologists for another show trial rather than consider such possibilities as corruption, laxly enforced building codes, and poor zoning of new developments.
Still, the 1:50,000 geological maps completed before 1:10,000 surveying was halted show what can be done with comparatively trivial funding compared to the waste and mismanagement that results from ignoring knowledge obtained by artisanal research and embodied in the staff of any prudent nation’s geological survey. This work needs to be published in easily assimilable printed formats with proven preservation potential over many centuries. While there can be quantum leaps in manipulating data to produce ever more innovative outputs, electronic databases can become corrupted and outdated, requiring expensive digital archaeology to retrieve.
Valid exercise
Furthermore, while a published 50k map is indeed ‘frozen’ in time, this process tries to ensure that the more detailed mapping and observations across a whole district can become a much more cohesive interpretation of all available data, including, in Britain, the influence of otherwise confidential borehole records. Given this, once coverage for a district has been brought to a higher standard, for several decades such a survey will outlast other sheets only covered by an incoherent patchwork of new observations and (sometimes conflicting) academic research, within a digital database which will become increasingly opaque unless all changes are clearly written up with an endless series of notifications and modification maps tied to a geographically searchable index.
Misplaced priorities
At BGS, systematic geological mapping had been going on since 1835 until it was recently halted. This vital task should be considered a national priority, and perhaps would be, were it not for progressively outsourced and consultant-driven Whitehall departments who are unable to see its significance within what has become an increasingly research-council-led organisation.
Rather than geographically biased research-driven cherry picking, systematic geological mapping requires modern legislation to provide access and preserve much more information from temporary sections and the input of highly skilled and motivated geologists to sustain this vital working knowledge for the efficient maintenance of our basic infrastructure.
Acknowledgements
Marco Pantaloni of the Servizio Geologico d'Italia – ISPRA, V. Brancati 60, 00144 Roma is thanked for making critial comments on an ealier draft, and facitating pdf copies of ISPRA publications and providing copyright clearance for reproducing these extracts.
* David Nowell is a freelance geologist whose publications include over 120 reviews of geological maps and books.
References
- http://www.legislation.gov.uk/ukpga/Vict/8-9/63/introduction
- http://www.bgs.ac.uk/gbase/londonearth.html
- http://sgi.isprambiente.it/geoportal/catalog/sgilink/sgilink.page
- http://sgi1.isprambiente.it/GeoMapViewer/index.html
- High Speed Two Ltd., December 2009. Route engineering study final report: a report for HS2 (Arup) on behalf of the Department of Transport
- HS2 Ltd., March 2012. Engineering options report West Midlands to Manchester. (MSG - Mott Macdonald Scott Wilson Grimshaw) on behalf of the Department of Transport