In setting out to better understand what drives plate movements, not only did Lucia Perez-Diaz, Graeme Eagles and Karin Sigloch cast doubt on the theory of plume-push – they also unearthed a potential error in the calibration of our geological timescale
Perez-Diaz, L, Eagles, G and Sigloch, K., Plates, plumes and geological time: Are we wrong about plume-push? Geoscientist
30 (9), 10-15, 2020
https://doi.org/doi: 10.1144/geosci2020-110,
Download the pdf here
Since the emergence of plate tectonic theory in the 1960s, geoscientists have pondered the question of what forces are involved in keeping tectonic plates moving. One way to try and answer this question is to examine present-day patterns of plate motion - but to have confidence in this approach depends on good timing.
Today, time can be known and followed precisely. We define and measure seconds using immutable atomic-scale physical processes. Embedded in satellite navigation equipment, we can use this technology to determine locations and speeds, including those of tectonic plates, with breathtaking accuracy.
These measurements support the notion that the movement of tectonic plates today is ruled by sets of forces generated at their boundaries and bases, transmitted over long distances through their rigid interiors. But was this always the case? Is it possible that episodic Earth system events not seen anywhere on the planet today may have impacted on plate movements in the geological past? In order to pursue this question, we focused on the Réunion plume, whose arrival beneath eastern India 67 million years ago led to the eruption of over a million cubic kilometres of basalt that underlie the Deccan Traps. In doing so, we found that not only do mantle plumes seem to have little effect on driving the motion of tectonic plates, but that part of the timescale around the Cretaceous-Paleogene boundary could be in need of revision.
Reconstructing past plate motions
We can reconstruct plate motions for the recent past (i.e. less than 200 My) with relative ease and high precision, thanks to the sharpness of magnetic polarity reversal signals recorded in oceanic lithosphere. The oceanic crust is continually generated in the presence of a geomagnetic field that periodically and unpredictably reverses, so that the locations of the north and south magnetic poles swap. This polarity is recorded in the lithosphere, with the orientations and spacings of these so-called magnetic isochrons either side of spreading centres worldwide providing quantitative information about spreading orientations and changing plate locations over time. (Fig. 1).
To look further back in time, we need to know the numerical ages of the isochrons using geomagnetic timescales. Without these, it is all too easy to misinterpret - within the context of a timescale, a set of closely-spaced magnetic isochrons can reliably be taken to indicate a period of slow seafloor spreading, in the same way that closely spaced rings on a tree-trunk indicate slow growth. Without a timescale, the same set of isochrons might just as well indicate a period of rapid plate motion during a period of high-frequency polarity reversals.
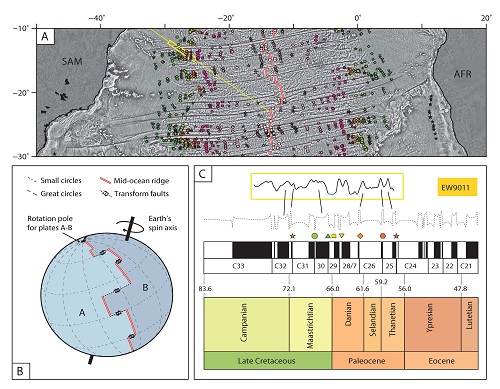
Left: Fig 1 - A) Seafloor spreading data (magnetic anomaly picks and fracture zone traces) used to model South Atlantic plate motions (Pérez-Díaz, Eagles and Sigloch, 2020). Background image shows vertical gravity gradient (Sandwell and Smith, 2014). B) Diagram illustrating the spatial relationships between a divergent plate boundary and the small and great circles about the pole of rotation describing the motions across it. C) Cartoon illustrating the process of interpreting and dating magnetic isochron picks from a magnetic anomaly wiggle (from cruise EW9011, solid line) by correlating it to a synthetic curve (dashed line) calculated from the pattern of polarity reversals in the geomagnetic timescale.
What drives plate tectonics?
Accurate GPS-based measurements of current plate motion tells us that the fastest-moving plates are those in which a large part of the plate boundary is a mature subduction zone, and the slower-moving plates are those that lack subducting boundaries or that have large continental blocks embedded in them (Zahirovic et al. 2015). This all seems to confirm that plate motion is controlled by the gravitational potential of its surface and subducting parts, and to a lesser extent by viscous coupling between their bases and the underlying mantle, and that tectonic plates are essential motive parts of the vehicle of Earth’s convection system, rather than mere passengers (Fig. 3A).
For the distant past, the geological timescale is accurate enough to show that the tectonic plates have usually moved at similar speeds to today’s, but also that those speeds have changed gradually through time. Any large and sudden changes in a plate’s speed or direction may therefore indicate the action of some exotic process, other than oceanic ageing and subduction, that is important for plate motion.
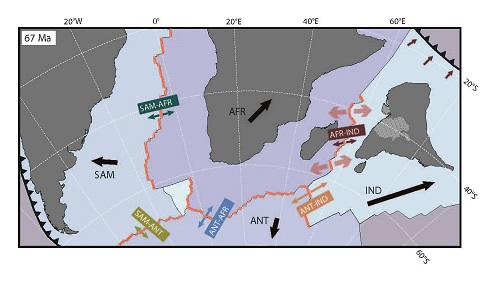
An example of one such evocative change is the apparent abrupt speed-up of the Indian plate between the late Cretaceous and the early Cenozoic. This short-lived event (~67-52 Ma) is clearly recorded by the spacings of magnetic anomaly lineations formed at the divergent India-Africa (IND-AFR) and India-Antarctica (IND-ANT) plate boundaries (Fig. 2). Neither the top spreading rate reached, exceeding 200 km/Myr, nor the acceleration that achieved it, can easily be explained in terms of any normal pattern of subduction zone evolution at the plate’s northern boundary (Cande et al., 1989, van Hinsbergen et al., 2011).
Multiple suggestions have been offered, including double subduction at the Indian plate’s northern boundary (Jagoutz et al., 2015), reduction of basal drag on the Indian plate by smoothing of its lithosphere-asthenosphere boundary (Kumar et al., 2006), and uplift of parts of the mid-ocean ridge west of India (Eagles and Wibisono, 2013).
Amongst all this geodynamic intrigue, it was quickly noted that the Indian acceleration coincided with the arrival of the Reunion mantle plume, which was responsible for the eruption of the Deccan Traps Large Igneous Province (Fig. 2). As dinosaur fans all know, the Réunion-Deccan plume has long been suspected of playing an exacerbating role in the late Cretaceous mass extinction, making it one of the best-known examples of a direct link between mantle convection and global biotic and environmental change. The temporal and spatial coincidence of plume arrival and plate acceleration thus prompted an addition to the plume’s resumé: the idea of a “plume-push” force that is significant enough to cause large tectonic plates to break the planet’s usual speed limits. And so, a new hypothesis was born.
 Right: Fig. 2
 -
Schematic diagram of the Indo-Atlantic plate circuit at the time of arrival of the Réunion plume. Thick black arrows show the magnitudes and directions of plate movement over the mantle. Smaller arrows show the orientations of relative motions at the plate boundaries. White hatching: present-day extent of Deccan Traps. Red arrows: location and sense of hypothesised plume-related push forces. Plates are AFR: African, ANT: Antarctic, IND: Indian and SAM: South American
Pushy plumes
Like all good hypotheses, plume-push is simple: it states that plume arrival beneath a lithospheric plate leads to doming that increases the plate’s gravitational potential energy by an amount large enough to affect the pre-existing force balance, and thus change plate motion (Fig. 3B). Starting from this, Cande and Stegman (2011) noted that the Réunion plume arrived close to the boundary of the Indian and African plates, and should thus have imparted push forces on them both. They concluded that these forces were so overwhelming that they brought knock-on effects for all plates that shared boundaries with the African and Indian plates late in the Cretaceous.
These so-called tectonic reorganizations are well known from global plate models. The best-known examples are relatable to unusually rapid changes in plate boundaries, such as when a major subduction zone ceases to operate after using up its supply of oceanic lithosphere. Plume-push thus stands to add complexity to the task of identifying and understanding the causes of plate tectonic reorganization events.
Plume push is also, like any good hypothesis, testable. The most well-known study, by Cande and Stegman (2011), examined the rates of late Cretaceous and Paleogene plate divergence around the margins of the Indian and African plates. Their test followed from a recognition that, at the time of plume arrival, both the Indian and African plates were moving towards the northeast, albeit at different rates (shown by black arrows in fig. 2). The gravitational push force resulting from lithospheric doming associated with a plume arriving at the IND-AFR boundary would have opposed the motion of the African plate at the time, but favoured that of the Indian plate (red arrows in figs. 2 and 3B).
The testable consequences of this would be accelerations along the boundaries of the Indian plate with its neighbours (Africa and Antarctica) and simultaneous decelerations along boundaries of the African plate elsewhere (SAM-AFR and AFR-ANT). Cande and Stegman searched for records of these anticorrelating spreading rate changes in the floors of the Indian and Atlantic oceans. They used models of plate divergence based on hundreds, or even thousands, of crossings of conjugate magnetic isochron pairs, which are much less prone to local geological and interpretational variability. By showing the models they chose to be consistent with the changes expected of plume push, their study has since been invoked as the main proponent of the validity of plume-push.
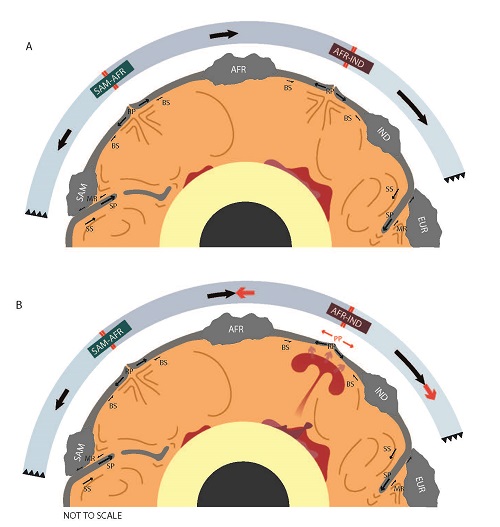 Left: Fig. 3 - A) Schematic diagram illustrating our current understanding of plate-mantle interactions and B) implications of the introduction of a plume-push force into the system, according to the plume-push hypothesis. Plates are the same as in figure 1. BS: Basal Drag; MR: Mantle resistance; PP: Plume push; RP: Ridge Push; SP: Slab Pull; SS: Slab Suction.
A higher-resolution test
Nevertheless, the suite of plate motion models Cande and Stegman used was not ideally suited for testing plume push. We decided to see if the hypothesis was robust enough to pass a more rigorous version of the same test.
One shortcoming of the earlier test was that the models chosen were built using a variety of statistical techniques, each with its own pros and cons that bias eventual reliability in particular ways. In order to avoid introducing uncertainty into our interpretations by comparing models with variable biases, we set out to calculate spreading rates for the five plate pairs in the circuit from kinematic models all produced using the same technique.
A second shortcoming concerned temporal resolution. Radiometric dating of the Deccan Trap basalts places the time of plume arrival at around 67 Ma. We needed models that imaged even small changes in the period between magnetic isochrons C29-C27 (67-64 Ma) – we can’t interpret what our models can’t see.
Our existing models for four of the five plate pairs - IND-AFR, IND-ANT, SAM-ANT and AFR-ANT - already achieved this resolution, and so could simply be dusted off ready for use in the new study. But there was no model of South American-African plate divergence. By re-examining available marine magnetic profiles, we increased the size of the modellable database by over 2000 isochron picks, 389 of which are for isochrons within the critical 68-57 Ma period. Our new South Atlantic model thus depicts the events in this short interval in more detail than ever before (Fig. 1).
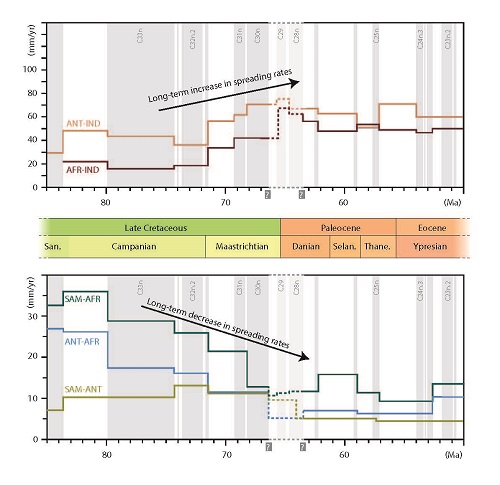
Divergence rates calculated for the IND-AFR and IND-ANT plate pairs replicate Cande and Stegman’s previous observations of sharp short-lived spikes (119% and 78% respectively) centred at 65 Ma. But we were unable to replicate the deceleration that would be expected of a plume-related push force., Our higher-resolution models for all other spreading centres around the African plate depicted similar short-lived accelerations (Fig. 4). All were significant increases over the pre-Deccan rates- by 60% in the South Atlantic (SAM-AFR), 35% in the SW Indian Ocean (AFR-ANT) and 54% in the Weddell Sea and Southern Ocean (SAM-ANT).
Can plume-push overwhelm entire plate circuits in the way described in figure 3B? Our answer was an emphatic “no”. But it immediately gave way to a new and perhaps even more puzzling question: how might we explain simultaneous divergence rate accelerations across almost half the globe’s spreading centres?
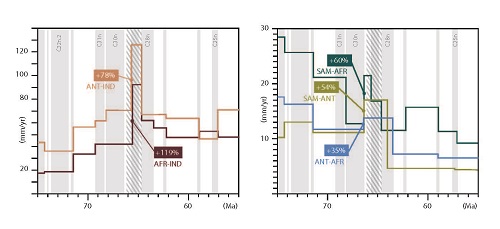 Right: Fig. 4 - Spreading rate changes for the five plate pairs in the Indo-Atlantic circuit. Percentage values indicate spreading rate increase at chron C29 with respect to pre-Deccan rates. Background shows magnetic reversal timescale of Gradstein et al. (2012). Hatching: Deccan volcanism
Reassuringly boring
It is worth noting that not only do all five spreading centres within the Indo-Atlantic circuit accelerate simultaneously for a short period of time, but that afterwards they revert to their pre-Deccan trends. The period of fast rates appears not to have affected any of the plates involved, for instance by increasing their area or average temperature, or the length and depth of subducting slabs, in a way that might have changed the balance of forces that maintained their motion prior to the plume’s arrival. That is, the accelerations appear to be without geodynamic cause or effect.
The most obvious non-geodynamic explanation is that that acceleration is simply an artefact of a timescale error. If so, it should also affect any model of sufficient resolution over the Deccan period for any other pair of diverging plates, anywhere in the world. A brief test of this idea using two published models, for the northern central Atlantic (Machiavelli et al., 2017) and southern Pacific oceans (Wobbe et al., 2012), indeed revealed similar divergence rate peaks.
Seafloor spreading rates are calculated by considering the widths of swaths of oceanic lithosphere formed over periods of time whose durations are obtained by assigning numerical ages to magnetic anomaly isochrons at the swath edges (Fig. 1). In this case, the observed divergence rate spikes would almost disappear if the period between magnetic anomaly chrons C29 and C28 had in fact lasted for a time between 57% and 70% longer than is currently presented in the geological timescale. This would mean that the boundaries of the old end of C29 and young end of C28 in the current version of the geological timescale might be too closely-spaced by somewhere between 1.7 and 2 Myrs.
When spreading rates are adjusted to account for our proposed timescale error (Fig. 5), they reflect reassuringly boring plate behaviour. In terms of seafloor spreading rates at least, no speed limits are broken in this adjusted history. Peak rates, in the Indian Ocean, are not much different to those at today’s fastest spreading ridge, the East Pacific Rise. These long-term trends reflect the slow kinds of changes in the distribution and activity of plate boundaries that can be inferred from the pattern of GPS-derived present day plate motions (Fig. 2).
A calendar in constant revision
We can’t look up geological time precisely on a pocket-sized device because process preserves atomically-defined frequencies over long periods with enough accuracy. Atoms, however, do help us to build the skeleton of geological time by determining more or less precise radiochronological ages whose spacing is determined by the vagaries of rock formation and preservation(and research funding).
A variety of geological tools, based on understanding of orbital, evolutionary or geodynamic processes, are applied to interpolate between those ages. Built in this way, today’s geological timescale is undoubtedly one of the greatest achievements in Earth science. It allows us not only to fit 4.6 billion years’ worth of Earth’s history onto a handy bookmark but also to accurately pinpoint events in some stretches of the geological past to within a few thousand years’ precision.
The rates of the orbital, evolutionary and geodynamic processes used to build the timescale can be expected to have changed over geological time. Along with the fragmentary nature of the rock record, this means that no single interpolation can be applied over the entirety of geological time. The timescale thus comprises a spliced set of diversely-calibrated sub-timescales. Given the variety of techniques and data sets involved in generating these sub-timescales, splicing them is a procedure fraught with potential pitfalls, explaining why the timescale remains under constant revision. The Cretaceous-Paleogene boundary, the moment of our study’s startling global pulse of plate motion, is the location of one such splice between two separate orbitally-calibrated stretches of time and, we suspect, the location of one such pitfall.
 Left: Fig. 5 - Adjusted model divergence rate changes, accounting for our proposed timescale error affecting the period between chrons C29-C28
What next?
Our test returned little evidence for the suggested influence of plume arrival on plate motion. Instead, it revealed an unusual, and most likely global, signal that is difficult to explain using the contents of the current geodynamic toolbox. The simplest explanation is likely to be a significant miscalibration of the geological timescale over the Cretaceous-Paleogene boundary. Of course, like plume push was for us, the idea of a miscalibration is for now a hypothesis, one that we hope will be thoroughly tested by chronostratigraphers.
And what about plume push? For now, at least, we can best conclude that if plume arrival has an effect on plate speeds, then it seems to be a second- or lower-order one too small to pick using the combination of currently-available plate motion modelling techniques and the example of the Deccan-Réunion plume. Deccan-Réunion seems therefore to have played a bit part, rather than acted as choreographer, for the dance of the plates at the end of the Cretaceous.
Authors
Lucia Perez-Diaz, Graeme Eagles and Karin Sigloch, Department of Earth Sciences, University of Oxford
Further reading
This article is based on our recent study:
Pérez-Díaz, L., Eagles, G. and Sigloch, K., 2020. Indo-Atlantic plate accelerations around the Cretaceous-Paleogene boundary: A time-scale error, not a plume-push signal. Geology.
References
Amante, C. and Eakins, B. W., 2009. ETOPO1 1 Arc-Minute global relief model: Procedures, data sources and analysis. NOAA Technical Memorandum NESDIS, NGDC-24, 19p. doi: 10.1594/PANGAEA.769615
Cande, S.C., Labrecque, J.L., and Haxby, W.F., 1988. Plate kinematics of the South Atlantic chron C34 to present: Journal of Geophysical Research, v. 93, doi:10.1029/JB093iB11p13479.
Cande, S.C., and Stegman, D.R., 2011. Indian and African plate motions driven by the push force of the Réunion plume head: Nature, v. 475, p. 47–52, doi:10.1038/nature10174.
Eagles, G., and Wibisono, A.D., 2013. Ridge push, mantle plumes and the speed of the Indian plate: Geophysical Journal International, v. 194, p. 670–677, doi:10.1093/gji/ggt162.
van Hinsbergen, D.J.J., Steinberger, B., Doubrovine, P. V., and Gassmöller, R., 2011. Acceleration and deceleration of India-Asia convergence since the Cretaceous: Roles of mantle plumes and continental collision: Journal of Geophysical Research: Solid Earth, v. 116, p. 1–20, doi:10.1029/2010JB008051.
Jagoutz, O., Royden, L., Holt, A. et al. 2015. Anomalously fast convergence of India and Eurasia caused by double subduction. Nature Geoscience 8, 457-478, doi:10.1038/ngeo2418.
Kumar, P., Yuan, X., Kind, R. and Ni, J., 2006. Imaging the colliding Indian and Asian continental lithospheric plates beneath Tibet, Journal of Geophysical Research, 111, B06308, doi: 10.1029/2005JB003930.
Macchiavelli, C., et al., 2017. A new southern North Atlantic isochron map: Insights into the drift of the Iberian plate since the Late Creta¬ceous: Journal of Geophysical Research: Solid Earth, v. 122, p. 9603–9626, https://doi .org/ 10.1002/2017JB014769.
Wobbe, F., Gohl, K., Chambord, A., and Sutherland, R., 2012. Structure and breakup history of the rifted margin of West Antarctica in relation to Cretaceous separation from Zealandia and Bell-ingshausen plate motion: Geochemistry Geo¬physics Geosystems, v. 13 p.
Zahirovic, S., Müller, R.D., Seton, M. and Flament, N., 2015. Tectonic speed limits from plate kinematic reconstructions. Earth and Planetary Science Letters, 418, pp.40-52.