 Geologists in the energy industry can improve their company’s financial performance, environmental impact and engagement by reviewing their involvement with water, writes John Simmons*.
In the increasingly vibrant debate about the effect of energy production on the environment, the focus has been largely on anthropogenic CO2 and the need to leave hydrocarbons in the ground. While that debate rages in forums at national and international level (see, for example, Soapbox, this issue), another aspect of energy production, with a significant effect locally and regionally, attracts far less attention.
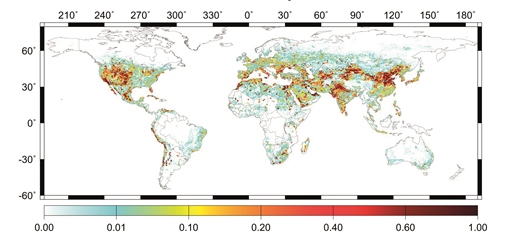
Image: Global water scarcity indicated on a scale of 0 – 1. Regions with an index of 0.4 or greater are considered to be highly water stressed6.
Water is critical in the extraction of coal, gas, oil, uranium and geothermal energy. That involvement is widely misunderstood, seldom measured or reported correctly, and rarely optimised. As the competition for limited water resources and the need to protect catchment areas increase, along with growing pressure from the public and media, these factors pose a growing risk the continued sustainability of extractive operations.
‘Sustainability’ of an industry depends on recognising risk and, in order to do that, facts are essential - gathered from research, set in a logical context, and tested for their veracity and relevance to real-world settings. Gathering such data lay at the heart of a BP initiative begun in 2010 and still continuing today, known as the Energy Sustainability Challenge (ESC). The initiative was driven by Professor Ellen Williams, then BP Chief Scientist. She wrote:
“The ESC’s aim is to gather facts and organise them in ways that can be accessed readily by policymakers. With water there were particular challenges; understanding the language around water use, appreciating the different ways in which volumes are measured and recorded and making reasonable extrapolations from the data available in developed countries to take account of data gaps in less developed nations”
 The results of the initiative, which involved researchers at 13 universities, are the publication of numerous peer-reviewed papers on a variety of topics and the production of three new handbooks, including ‘Water in the energy industry – An introduction’ a freely available text from which the tables and graphs in this article are all taken1.
The book is aimed at providing an introduction to many aspects of water across the energy industry, and geologists will find many familiar concepts described. I hope the book will cause individuals from many professions to examine water use in their workplace and be motivated to take positive action. Geologists across the extractive industries have the opportunity to use their skills and experience to minimise their impact on water. By examining water use across exploration and production it is, in many cases, possible to reduce both capital and operational expenditure. In some operations there may even be opportunities to increase the energy produced significantly.
Choice words
The first step towards understanding water’s role in the energy sector is to clarify our language. When referring to water, the media regularly offer statements such as: ‘On average, a vegan indirectly consumes nearly 600 gallons of water per day less than a person who eats the average American diet’ or ‘A gallon of gasoline takes nearly 13 gallons of water to produce’2.
These sorts of statements are woven into many debates about water and combining ‘statistics’ with the misuse of verbs such as ‘consume’ and ‘takes’, results in chronic misinformation that negatively influences the development of onshore oil and gas and other energy projects. Unfortunate choice of language lies at the heart of the hydraulic fracturing debate, where statements such as, ‘Oil and natural gas fracking, on average, uses more than 28 times the water it did 15 years ago, gulping up to 9.6 million gallons of water per well and putting farming and drinking sources at risk in arid states, especially during drought.’3
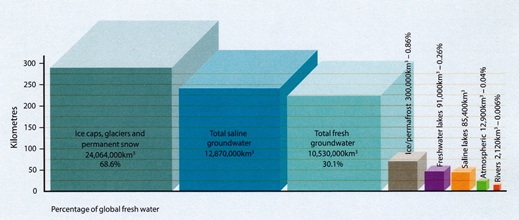 Image: Saline and fresh water on earth: the cubes illustrate the relative world total volumes. Seawater, which accounts for 96.54% of all the water on earth, is not shown. Percentages are shown for freshwater volumes only4.
In an attempt to provide clarity, we decided to offer the following definitions. If widespread agreement on such definitions could be gained, understanding of water in industry would improve (and that quote from Scientific American would be a lot different). The volume of water consumed is vastly different, in most cases, from that ‘gulped’.
- Water use: the non-technical understanding is quite different from the engineering definition. In engineering, the same water can serve several functions in a process, and each will be counted as a ‘use’. As a result the amount of water used in the engineering sense can be many times larger than the amount of water withdrawn.
- Water withdrawal: water extracted from a source, at least temporarily, for use including domestic, industrial, energy-related or agricultural use. Water withdrawals are classified as either surface (from rivers, lakes or reservoirs) or groundwater withdrawals. Withdrawn water may be returned to the source, recycled, evaporated to atmosphere, disposed in a storage site for contaminated water, or embodied in a product, so water withdrawal is not necessarily the same as water consumption.
- Consumed water: consumption is the portion of withdrawn water not returned to the surface or groundwater in the same drainage basin from which it was abstracted. Consumed water is evaporated, transpired, incorporated into products or crops, or otherwise removed.
- Fresh water: commonly used term to distinguish river water from brackish or seawater. Definitions vary, but fresh water generally has total dissolved solids (TDS) of less than 1000 mg/litre. This definition does not take into account other contaminants such as organic chemicals (see ‘Water quality’).
- Reused water: used water and wastewater that is used again before discharge for final treatment and/or discharge to the environment. Reused water includes wastewater used for irrigation within a facility boundary. It also includes harvesting of rainwater within a facility boundary.
- Recycled water: water that undergoes significant treatment (to reduce salinity and/or other contaminants), such that its quality is sufficient for other uses requiring fresh or near-fresh water.
Chalk and cheese
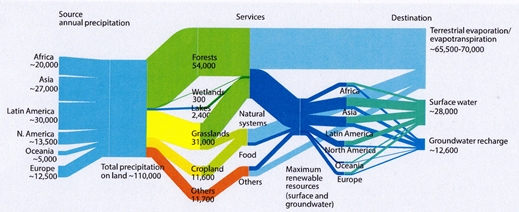
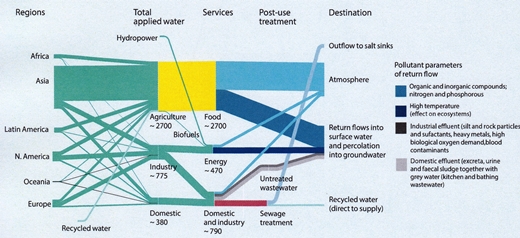 Image: Global freshwater Sankey diagram for annual precipitation over land. The vertical width of each bar in the diagram is proportional to the volume of fresh water involved, measured in cubic kilometres (km3), and numerical amounts are provided with labels, also in km3. Polar regions not included5.
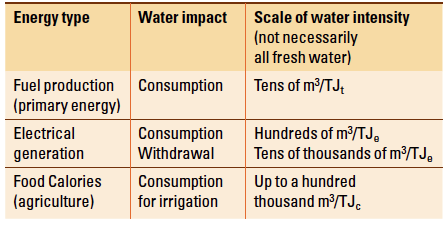
One of the challenges faced in writing the book was how to compare water use across the range of energy industries. We chose to consider the volume of water used per unit of energy - expressed in cubic metres of water per Terrajoule of energy – or m3/TJ. This measure can be applied to the production of primary fuels, to the generation of electricity and also, for comparison, to the production of food calorie production, using irrigation. The reported numbers, shown below, make interesting reading and potentially useful arguments for inclusion in debates on sustainability.
So - how much water does the energy industry use? A group of researchers at the University of Cambridge have calculated that 470km3 of fresh water are withdrawn annually by the energy sector. Ultimately, this is either returned to the hydrological cycle, evaporated or exposed to various levels of contaminants and post-use treatment.
Image: Global Sankey diagram for annual water withdrawn for human use5. Continental distribution of withdrawals, sectors (agriculture, industry, domestic), services provided by the water, and return of water to the hydrological cycle. Changes in quality during use are indicated (colours). Red indicates energy used in wastewater treatment.
 To place that volume in context, it is necessary to examine the availability of freshwater for human use. Over 96% of the water in the hydrosphere is contained in the oceans. Of the remainder, most is found in permanent ice caps, glaciers and saline aquifers. Less than 1% of the total is in fresh groundwater, and the water that we normally think of as being easily accessible – rivers and lakes - constitutes only 0.01% of the water on Earth.
Of course the hydrosphere is dynamic, with a significant percentage of the water it contains in constant motion, driven by energy from the sun and resulting in annual global precipitation estimated at 111,000km3. As the Sankey diagram from the Cambridge researchers indicates, with most of that precipitation returning to the atmosphere through evaporation and transpiration, the volume remaining to recharge groundwater and fill surface water systems, known, as the renewable freshwater resource (RFWR) is about 40,000 km3. That volume is available to support the world’s aquatic ecosystems and, at the same time, is the water that can fulfil human demands. A second Sankey diagram indicates the end uses of water withdrawn by humans.
If all of this available water were evenly distributed, extraction problems would potentially still exist. However, in reality, availability varies widely. A metric known as the water scarcity index, or WSI, can be used to illustrate this – see map.
- Water scarcity index (WSI) = Annual freshwater withdrawal
Local renewable freshwater resource (RFWR)
It is implicit from the map of Global Water Stress that in areas of water stress, the withdrawal of any large volumes of water causes problems, especially for uses other than human consumption. As illustrated in the Sankey diagram, the Cambridge University group estimated that some 12% of human withdrawals (or 470 km3) are destined for the energy sector.
Comparing the scarcity map with the locations of energy production gives one indication of the challenges facing energy producers. The 12% figure includes water used for cooling in electricity generation (possibly over half of the total) and therefore not usually the responsibility of the geological community. The remainder is a volume that can be affected by decisions made by geologists.
Mined energy
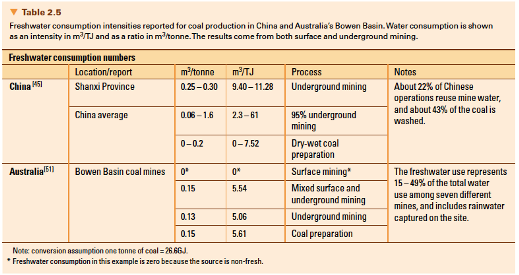
 In simplistic terms, withdrawn water volumes in exploration for energy minerals are minute - just water for drilling fluids and that actually ‘gulped’ by the explorers. In coal mining, machine cooling and dust suppression need relatively small volumes and fresh water is not needed. Coal washing uses significant volumes, but most can be recycled.
A similar picture to that for coal emerges for conventional uranium mining, with machine cooling and dust suppression requirements (the latter even more significant than in coal mines). In situ leaching (ISL) process naturally has different requirements. Fortunately, in most ISL mining operations, groundwater - often already containing significant uranium - is used as the basis for the leach solution. Water use in ore processing varies considerably, ‘heap leaching’ using far more than the conventional crushing, milling and leaching process. Conversion and enrichment did, in the past, demand considerable volumes, but the phasing out of the gaseous diffusion method in 2013 has greatly reduced water demand.
 Dealing with wastewater is a major challenge for the mining industry, particularly in uranium mining. Although recycling is used as extensively as possible in many mines, some water has to be disposed of - often in old workings or, in arid regions, by evaporation. Novel schemes have been pioneered by some mining companies in areas of water stress to treat coalmine water for human consumption. Any water that has come in contact with uranium minerals has to be disposed of, again in old workings, by evaporation or in specially drilled disposal wells.
Oil
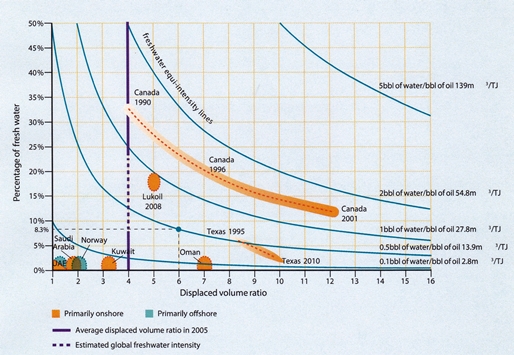
As mentioned above, water-use in exploration is small and the same applies in the primary phase of conventional oil production. ‘Produced water’ reaching the surface is separated and either re-injected to help maintain reservoir pressure, disposed of via injection wells, or treated for disposal by other means. However, as soon as reservoir pressure drops to levels below economically sustainable rates, secondary production - usually involving waterflood - begins. If 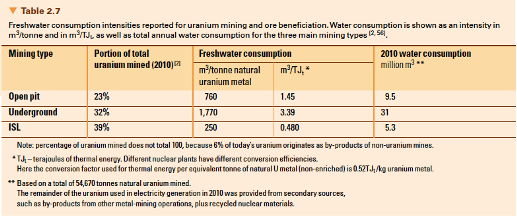 most of produced water is re-injected, then the volume of additional water required will be roughly equal to the volume of oil produced.
A wide variety of water qualities have been used for waterflood - ranging from seawater to the outflow from sewage treatment works! As any water that is injected will be affected by the chemistry of the reservoir, it can be assumed to take on the characteristics of produced water. Such water cannot be returned to the catchment area without considerable treatment, so it can be thought of as being ‘consumed’. The volume of freshwater thus consumed will depend primarily on the volume of produced oil and the fraction of re-injected water that is fresh. As alternatives to freshwater are increasingly being employed, the percentage used for injection is decreasing – see graph.
Gas
 Waterflood techniques are not used in conventional gas production so the volumes of freshwater consumed are limited to that supplied for drilling muds. However, as soon as hydraulic fracturing is employed to produce gas from tight sands or shale, then the availability of water becomes critical to operations. This is what lies at the heart of public apprehension about this technique.
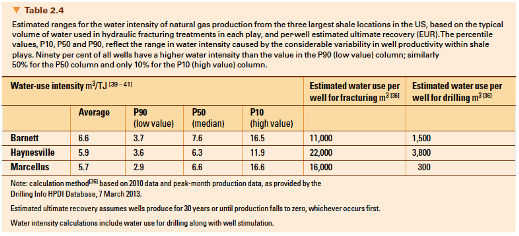
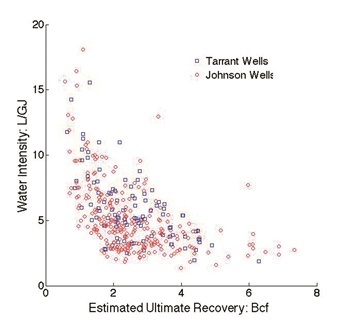
Much progress has been made in the last few years in the use of recycling, to minimise the need for freshwater and also the use of lower-quality water is increasing. Volumes vary widely, depending on the type of fluid system employed and the percentage of water that returns to surface as flowback. The latter parameter varies from well to well - mainly influenced, it is thought, by the lithology of the fractured unit. This variation is shown in the graph below where water intensity is plotted against estimated ultimate recovery of gas from 400 wells in the Barnett shale of Texas.
Until a well stops producing, it is impossible to accurately calculate the water intensity so the graph below is produced for three of the largest shale plays in the USA using estimates of the ultimate recovery.
Image: Freshwater consumption in conventional oil production for different regions and at different stages of field maturity. X - the ratio of total displaced volume (oil plus water) to oil produced. Y - percentage of injection water that is fresh. Solid curved lines - representative values of constant freshwater intensity ranging from 2.8m3/TJ to 139m3/TJ. Solid symbols show field conditions for UAE, Saudi Arabia, Kuwait, Oman, offshore Norway, Lukoil, Canada and Texas.
 Intensity comparisons
We were able to construct a table that allowed us to compare the water intensity for different primary energy sources (see tables above - please ignore the numbering, which derives from their source).
The wide variation in water intensity illustrated in that table serves as a further prompt for everybody in the energy industry – geologists especially – to consider what can be done to reduce water consumption. The book stresses four Rs: Replacement with non-freshwater, Reuse of water in processes, Recycling, and Regional responsibility - which calls for the adaption of practices to best suit local conditions.
Any reduction in water intensity has the potential to reduce costs, improve the environment, improve public engagement and the licence to operate. By definition, geologists can play a leading role in guiding such reductions.
Much is written in the book about water in the energy industry. However little is said about the energy contained in the water. Hundreds of millions of barrels of water are produced in oilfields daily, most of it at temperatures well above ambient. The energy held within this hot water is vast and, at the time of writing, little is captured.
Image: Scatter plot of water intensity in m3/TJ against estimated ultimate recovery in millions of m3 for 400 horizontal hydraulically fractured wells in the Barnett shale within Tarrant and Johnson Counties, Texas, US. The quantity shown is total water intensity, not freshwater consumption intensity, which will depend on the proportions of brackish water or reuse7.
 References
- These books are available free online: www.bp.com/energysustainabilitychallenge
- http://environment.nationalgeographic.com/environment/freshwater/water-conservation-tips
- Scientific American, July 2015
- Data from Shiklomanov, I A, 1993 in Gleick, P H: Water in Crisis, Oxford University Press
- Curmi, E et al 2013, Journal of Environmental Management, Vol 129
- Oki T & Kanae.S; Science, Vol 313, No 5790
- O’Sullivan.F 2013; Presentation to MIT/CIS Energy Sustainability Forum. Available from: http://mitei.mit.edu/mit-csis-workshop
*John Simmons, CGeol FGS, Principal Adviser, RPS Energy and Director, ON Communication
<ENDS>