Is there a human response to tectonic stress? Alan Watson* thinks so, and is about to publish a book about it. We asked him to share his evidence...
 Reports of ‘unusual animal behaviour’ before earthquakes became common during and after the 1960s - snakes coming unseasonally out of hibernation, dogs deserting their kennels, birds sensing impending quakes and, most recently, insects not resting. But, as anyone who has lived with animals will know, animals ‘behave strangely’ all the time; which means evidence of this kind suffers from a huge and possibly unresolvable ‘false positive’ problem. The trouble is, nobody bothers to record animals’ ‘normal’ behaviour. And even if you do watch them all the time, the quality of their behaviour is extremely tricky to quantify.
Humans, though are different. We have the media. I believe that comparing news reports with seismicity data provides compelling evidence that we humans may be responding to the effects of seismicity shortly before earthquakes.
Having observed what seemed to me to be an unusually large number of instances of riot and disorder shortly before reported earthquakes, I compiled a database of riots and obtained permission from the British Geological Survey (BGS) to use their comprehensive earthquake lists to make statistical comparisons.
The resulting statistically significant correlations, are grounded in a simple comparison of one list with another. My intention in this article is to summarise the facts about the relative timing of earthquakes and riot, and let you make your own mind up.
We all know the adage about correlation not necessarily meaning causation; but the first step must be to determine whether there is at least a correlation there. I believe the statistics show there is. The results could, I believe, be telling us something about the Earth and human behaviour, and may be worth pursuing further.
BISHOP’S CASTLE
On 1 April 1990 a disturbance broke out at Strangeways Prison, Manchester and quickly developed into a widespread insurrection. The riot and rooftop protest continued until 25 April, making it the longest incident of its kind in UK penal history.
My ideas about human behaviour being influenced by geological processes began to develop on the day after the Strangeways riots began. I was nearly knocked off the edge of my chair (and I don’t mean metaphorically - I was sitting on the 6th floor of a Gwent office block), when the Bishop’s Castle earthquake struck. This earthquake was at M5.1, occurring at only a little over 14km depth, and was caused (it is believed) by movement along the Pontesford Linley fault.
But why should there be any connection between a riot in Manchester one day, and a (for the UK) major earthquake in Shropshire the next? Why should the two occurrences be nothing more than an unrelated coincidence? I believe that by a close and rigorous application of statistics we may be able to detect a pattern. I believe it may be telling us something about how underlying processes, occurring deep within the rocks below our feet, may create a human response - a response that expresses itself in unrest or disorder in the period before earthquakes actually strike.
NEW GEOPHYSICS
 Conventional ‘sub-critical’ geophysics had never been able to explain satisfactorily how tectonic stress can accumulate over large lateral distances before high magnitude earthquakes without breaking out into multiple, low magnitude shocks. However, the ‘New Geophysics’ as has been suggested by Crampin and others (albeit controversially and with significant opposition), has recently suggested a mechanism whereby, prior to earthquakes, strain may be spread out thinly over large volumes of rock without initiating low magnitude earthquakes.
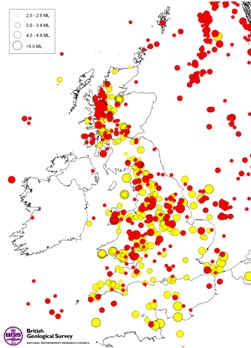
Figure 1 (right): Distribution of Earthquakes in the UK. Red dots represent instrumented records obtained in recent years, while the yellow dots are historical events known through contemporary reports of the after effects (Reproduced with the permission of the British Geological Survey ©NERC. All rights Reserved)
The geographical distribution of earthquakes in the UK <Figure 1> is well documented in data gathered since 1970 by BGS from their nationwide seismograph network <Figure 2>. This provides an ample database against which to assess the potential for any link between rioting and seismicity. England and Wales is a suitable site for comparing the incidence of earthquakes and riots as tectonic conditions are somewhat consistent within this land area, as shown by the prevailing stress regimes. <Figure 3.> Armed with a full dataset of earthquakes for the chosen period and a reliable list of widely reported riots, the statistical correlations that emerge are, I believe, strikingly clear.
STATISTICAL COMPARISONS
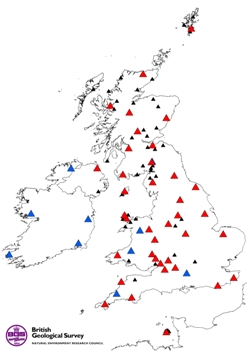 Figure 2: UK Seismograph Network. Red triangles are broadband stations, black triangles are short period stations and blue triangles are broadband stations operated by partner agencies. (Reproduced with the permission of the British Geological Survey ©NERC. All rights Reserved)
My first hypothesis might be stated thus: ‘That there is a significantly higher incidence of riot and disorder shortly before earthquakes, compared with the same period afterwards.’ An inspection of instances of riot and their causes can never be complete without a proper appraisal of the periods of peace and quiet. The two lists provide strong evidence that significant rioting is rarer during seismically quiescent periods.
A second hypothesis for testing then arises, namely: ‘That there is a significantly lower incidence of riots and disorder after more than 140 days has passed since the last most recent earthquake of 2.5ML or greater, compared with the incidence that would be expected by chance.’
Statistical tests have found probabilities of less than 1% that these two hypotheses are untrue. These probabilities are very low and contrast sharply with the usual perception – call it the default assumption - that there is no association between the incidence of riots and earthquakes.
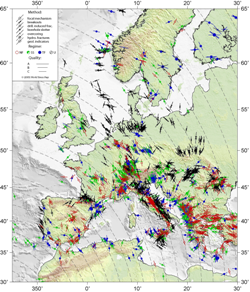 Figure 3: European stress map. Colours indicate stress regimes with red for normal faulting (NF), green for strikeslip faulting (SS), blue for thrust faulting (TF), and black for unknown regime (U). Lines represent the orientation of maximum horizontal compressional stress (SH), line length is proportional to quality. Grey lines are the trajectories of plate motion from Africa with respect to fixed Eurasia. (with kind permission from World Stress Map Project. Heidbach, O., M. Tingay, A. Barth, J. Reinecker, D. Kurfeß, and B. Müller (2010), Global crustal stress pattern based on the World Stress Map database release 2008, Tectonophysics, 462(1-4), doi:10.1016/j.tecto.2009.1007.1023. www.world-stress-map.org)
A substantial number of cases of riot appear in clusters with a common initial cause. My dual studies have therefore included both a full appraisal of these cases, including ‘tails’ of clusters as well as excluding them. One would imagine that copy-cat rioting in these tails of riot clusters would be influenced to a lesser extent by seismicity than might be the case for the initial onset of violence. The dual study therefore removes the uncertainties resulting from such potentially contaminating ‘sociological’ effects.
I also had to decide where to draw the line between what is and is not a ‘significant’ riot in this context. The compiled riot list, a selection from which is included in the table, is by no means a comprehensive catalogue of every mass disturbance that has occurred in England and Wales during the study period. Substantial instances of disorder occurred in many geographical areas at the time of the clusters in both 1981 and 2011; but some involved low numbers of arrests or limited injuries or damage to property. This contrasts with other cases where the substantial damage or large numbers of arrests to my mind justify inclusion in the list.
CONCERNS
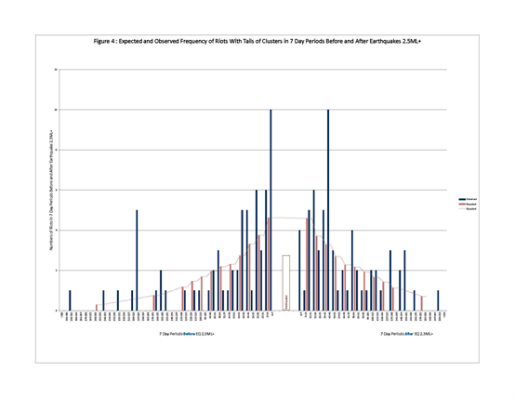 Figure 4 (left): Expected and observed frequency of riots with tails of clusters in 7 day periods before and after earthquakes 2.5ML+.
Naturally, this selection process is somewhat subjective, and might lay me open to an accusation of cherry-picking my data to suit my case. To allay such concerns, I have applied statistical sensitivity tests to assess the effect of including or excluding certain events. Ultimately, I intend to make the database of riots available on a dedicated website, with the opportunity for the public at large to suggest additions for verification, should gaps in the list be identified.
The relative timing of earthquakes has been studied in order to determine the number of riots that would be expected to occur by chance. The expected average frequency of riots will increase anyway in the period leading up to earthquakes due to the effect of ‘overlap’ in the time periods. The total number of days in T day periods immediately prior to N earthquakes is somewhat less than T x N because some earthquakes occur less than T days apart. This effect is lessened nearer to earthquakes as T approaches zero and overlap is less likely, meaning that the chance of a riot in any given 14-day period increases nearer to the shocks. One diagram <Figure 4> shows the expected and observed frequency of riots (with tails) in England and Wales 1980-2012 and another <Figure 5> shows a similar pattern without the tails of riot clusters.
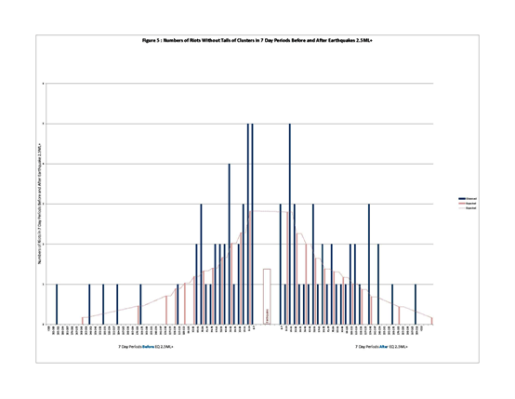 Figure 5: Numbers of riots without tails of clusters in 7-day periods before and after earthquakes 2.5ML+
In 14-day periods starting 70 days before all earthquakes in the study period, only 7% of riots would be expected to occur. This example has allowed for the effects of ‘overlap’ where earthquakes occur within 70 days of each other. If no association existed between the incidence of earthquakes and riots then about 14% of riots would be expected in the 14 days immediately before earthquakes. Statistical tests have compared the expected incidence with what is observed. In fact, as many as 25% of riots actually occur in the 14 days immediately preceding earthquakes.
Equally, if no association existed between earthquakes and riots, then about 14% of riots would also be expected in the 14 days immediately following earthquakes. In fact, as few as 8% of riots are observed to occur immediately after earthquakes. On this basis, we can say that there appear to be around three times as many riots in the 14 days before earthquakes compared with the 14 days after them. Naturally, the same number in both periods would be expected to occur by chance alone.
RATIO
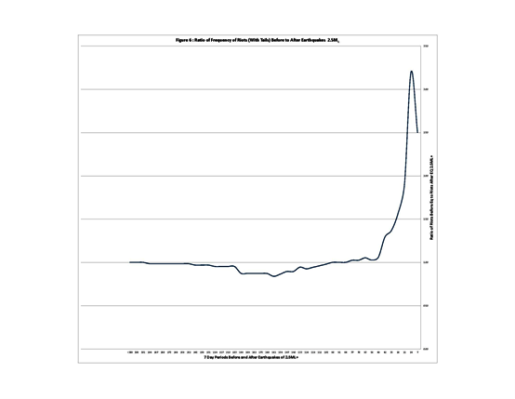 Figure 6: Ratio of frequency of riots (with tails) before to after earthquakes 2.5ML
The variation in the ratio between numbers of riots before and after earthquakes is presented graphically <Figure 6>. Interestingly, the average ratio reaches a peak of 3.2 within 14 days of earthquakes and then falls off to 2.5 within seven days. Is this indicative of the stress accumulation followed by relaxation described over large lateral distances by the ‘new geophysics’? The next diagram shows a similar trend for the case disregarding the ‘tails’ of riot clusters.
On average, the compiled list shows that riots occur roughly every 189 days, while earthquakes of 2.5ML or greater occur, on average, every 78 days. This should put into perspective how small a ‘window’ the 14-day period before earthquakes represents.
These observations suggest to me that there may be something in the idea that seismic influences may draw the incidence of riots towards periods of generally higher stress prior to its impending release.
I have also studied the periods of seismic quiet since 1980. The retrospective classification of a ‘quiet’ period starts 140 days after the last most recent earthquake of 2.5ML or greater, and ends 14 days before the next earthquake. If there were no association between earthquakes and riots then about 22% of riots would be expected to occur in these periods. The observed incidence is that fewer than 5% of riots actually occur during quiescent intervals.
This to me seems even more striking, and is at least as significant for this project, because it shows that not only are riots more likely to occur shortly before earthquakes, but they are far less likely to occur during periods of low seismicity than would be expected by chance.
HUMAN RESPONSE
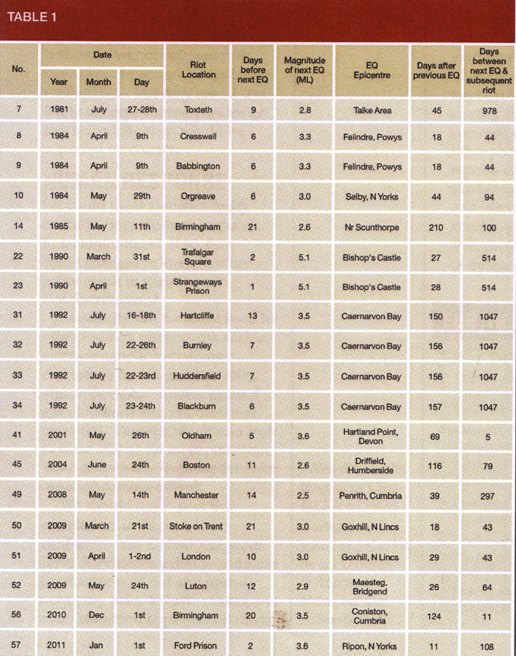
Table 1: Riots shortly before eathquakes: England and Wales, 1980-2012.
So, could these statistics really be indicating a human response to tectonic stress? If so, how could changes in stress within rocks result in variations in riot distribution?
Seismicity can manifest itself in other indirect phenomena such as electromagnetic variations, changes in hydro-geochemistry, atmospheric conditions, ground gas emissions and gravitational potential. Perhaps we should look to these effects for an explanation.
We should not expect this correlation, if it exists, to be confined to the United Kingdom. Indeed, evidence exists worldwide for instances of riot and unrest occurring prior to earthquakes, but a full statistical appraisal of other regions or countries lies beyond the scope of this current project. Nevertheless, this would almost certainly form a basis for future research, and one chapter of my book describes examples from India, Australia, China, Italy and USA among others, including a recent example from Turkey where the onset of widespread recent rioting was followed by a series of low magnitude earthquakes.
Summary
I believe my figures justify the following statements.
- There is a significantly higher incidence of rioting and disorder in the 14 day periods prior to earthquakes compared with the 14 day periods after earthquakes.
- The ratio of riot frequency before to after earthquakes falls off from a peak of 3.2 (with tails and 2.5 without) within 14 days to a lower ratio of 2.5 (with tails and 1.67 without) within 7 days of the shocks.
- There are substantially fewer instances of rioting and disorder when more than 140 days have passed since the last most recent earthquake of at least 2.5ML.
- These findings will provide support to other earth science studies about interactions between the biosphere and the lithosphere. There have been reports of unusual behaviour exhibited by birds, snakes and insects, among other species, prior to earthquakes. This project widens the scope of influence between the lithosphere and biosphere and asks the question: are humans influenced by the behaviour of the lithosphere in ways not yet understood?
- The statistics of riot and earthquake incidence serve to re-affirm seismology research known as ‘the new geophysics’ that tectonic stress may vary on a regional scale prior to earthquakes.
- The occurrence of riots, in certain circumstances, may provide one further factor to consider, when assessing the risk of an impending earthquake.
If proved, could this science have predictive value and be of service to society? There have been calls for investment in a global ground-stress monitoring network in order to improve our ability to stress-forecast earthquakes. If this investment were to go ahead, it might also provide an opportunity to re-evaluate security risks and perhaps indicate a need for heightened security in prisons, or during protest marches.
I feel there must be some rational explanation for the observations I have described. I do not believe I have cherry-picked my data and I do not think I have allowed myself to be bamboozled by statistics! I hope that this article will generate some interest among geophysicists. The full story, in Gravity and Mind – Human Response to Tectonic Stress is now available in e-book form.
* Alan Watson BSc (Eng) CEnv CEng MICE is a Ground Investigation specialist and writer. He is a Chartered Civil Engineer and a Chartered Environmentalist.
Further reading
- British Geological Survey List of Earthquakes of >2.5ML 1980 to 2012
- Crampin, S., S. Chastin, and Y. Gao (2003). Shear-wave splitting in a critical crust: III—preliminary report of multi-variable measurements in active tectonics. Journal of Applied Geophysics 54, special issue 265–277.
- Crampin, S., and Y. Gao (2013). The New Geophysics. Terra Nova 25.3, pp173-180.
- Baptie B (British Geological Survey). Seismogenesis and state of stress in the UK. Tectonophysics (2010) p150-159.
- Crampin S., Yuan Gao & Angelo De Santis, ‘A few earthquake conundra resolved’ December 2011 – intended for publication in J. Asian Earth sci.
- Friedemann T Freund, Akihiro Takeuchi, Bobby W S Lau : Electric currents streaming out of stressed igneous rocks – A step towards understanding pre-earthquake low frequency electromagnetic emissions. Physics and Chemistry of the Earth 31 (2006) 389-396.
- Friedemann T Freund : Toward a unified solid state theory for pre-earthquake signals. Acta Geophysica, Volume 58, October 2010, Issue 5, p 719-766.