Mark Woods* and colleagues from British Geological Survey ask: How can we confidently predict the nature of the ground beneath us?
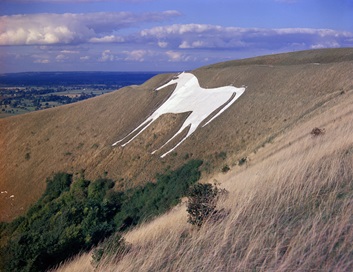 Britain is blessed with a magnificent variety of landscapes, much of it the result of the diverse range of rock types that form our small island, and the different ways in which they respond to weathering and erosion. Nowhere is this clearer than when enjoying a walk along many of the paths that snake around our coastline; dramatic colour changes in the cliffs, steep climbs and descents between headlands and bays all reflect changes in the underlying geology.
Sometimes the connection is obvious, such as the contrast between the low, sandy and muddy cliffs that tumble into the sea along the coast of Essex, and the rugged white cliffs on the south coast of England. These natural features, which we take for granted, have a significant impact on how we live and move about our island.
Our modern society requires a huge variety of infrastructure and resources, not just the things we see at the surface, but things we build in and extract from the underground. Much of the water we consume in our homes and factories comes from buried bedrock units – supplies that we must manage, predict and safeguard from contamination. Rapidly varying geology might be good for landscape diversity, but it can create real headaches for planning future growth and economic development.
Variability
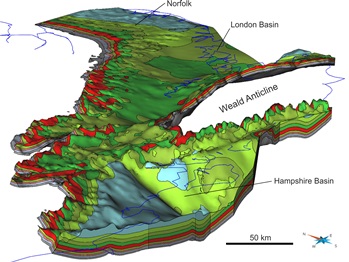
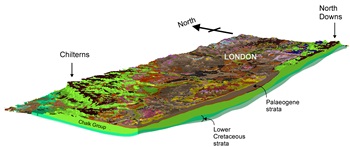 Image right: 3D geological model of the London Basin showing geometry of main bedrock geological units (Burke et al., 2014). BGS©NERC. All rights reserved. 2015.
Currently, we only have highly detailed understanding of how rocks’ physical properties vary in relatively limited areas, where geological units are of particular commercial interest – for example, the hydrocarbons industry, which requires a holistic knowledge of how such properties relate to geological structure, and burial history. More generally, what we need is a broad 3D model framework capable of containing disparate data types and showing how they inter-relate.
This approach would provide a comprehensive overview of observable data, display statistically-derived predictions for regions lacking data, and allow new models to be calculated as new observable data become available. This is the goal of current work at the British Geological Survey (BGS), focusing on the Chalk Group (hereafter ‘Chalk’) of southern England and East Anglia.

Image left: Example of a borehole geophysical log – used to interpret Chalk stratigraphy and variations in physical properties. BGS©NERC. All rights reserved. 2015.
Conventionally, field geologists slowly accumulate knowledge about the extent of rock variation in the subsurface as they make geological maps and cross-sections; but the rock classifications used in these documents typically only provide an overview of physical properties for each unit. Related memoirs, sheet explanations and published papers may provide more detailed descriptions of variation within units, but it may be difficult to relate spatially all of this information to the geological map in order to arrive at a trend synopsis. Furthermore, the extent and resolution of the data are likely also to be highly variable.
Ideally, we want to be able to see beneath our urban and rural landscapes, and observe both the distribution and thickness of different geological units and the range of internal variation within each. We want to envisage how these properties vary across broad swathes of country, and understand the extent to which these features are affected, and/or controlled by, structural features, such as patterns of faulting.
With this knowledge we could predict geographical trends, in things such as patterns of hardness and compositional changes – variation that is not so great as to cause a geological unit to be differently classified, but that is enough to affect its behaviour for particular applications (such as its engineering and hydrogeological use). Recently, BGS has begun to explore how we can characterise variation in physical properties. The Late Cretaceous Chalk, with its wealth of recent research, relatively simple subdivision, structure and range of physical properties, provides the ideal test-bed to develop this innovative approach to geological parameterisation.
Chalk
The Chalk is one of the most widely occurring units across southern England, frequently worked during civil engineering projects, and one of the UK’s most important units for water supply. A walk beneath the towering 160m-high, dazzling white, flint-banded Chalk cliffs of Beachy Head (Sussex) is not for the faint-hearted – with dangerous tides and frequent rock falls; but recent work along this coast shows that even a seemingly uniform rock like the Chalk is riven with variations in physical characteristics.
Some units are very soft and lack flints, while others are intensely hard and fractured. Some are eve rich enough in clay to form a barrier to water migration through the rock. Variations in these properties have very significant implications for construction, water management and pollution control, as well as for evaluating the risk from ground-water flooding. Established stratigraphy 1, 2, which sub-divides the Chalk into formations, describes the general pattern of this variation but not the detail or regional differences that are potentially significant at the project-scale.
For example, the pattern of cementation in the Lewes Nodular Chalk Formation varies hugely across southern England, both in its degree and stratigraphical distribution. The typically marl and flint-rich Newhaven Chalk Formation is virtually devoid of these features in parts of East Anglia and Kent. If an apparently uniform rock like the Chalk can display such wide variation in physical characteristics, then it is clearly imperative to understand physical property variation across a broader spectrum of geological units that might be interpreted as ‘strategically important’ for national development and well-being.
Unique model
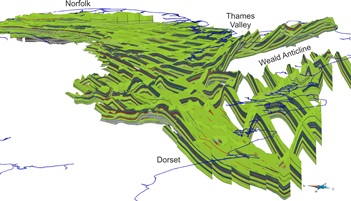
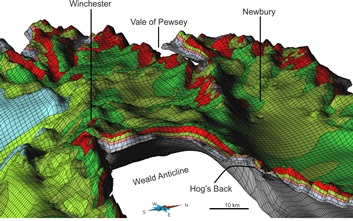 Image right: Cellular geological model showing Chalk formations to the west of the Weald Anticline. The area in the immediate foreground shows the Chalk arching around the edge of the broad dome formed by The Weald in south-east England. BGS©NERC. All rights reserved. 2015.
In recent years, the use of 3D geological models has become commonplace, like that recently developed for the London Basin3 (above right). In many of these, geological formations are the basic building blocks; but the range of physical property variation capable of being displayed is limited by the extent to which different sub-units have been defined. In the case both of formations and their sub-divisions (i.e. members), the only physical property data that can be inferred are the generalised details that define them. So if these formations are basin-wide, it is not possible to perceive regional trends and variations easily.
Ideally, physical property models would show the total amount of variation within a geological unit. In the case of commercial enterprises for which this knowledge is essential, huge investment can achieve this high degree of understanding across limited areas. However, attempting to duplicate such data-richness is impractical for large, basin-scale models. We need to balance what is useful to model against the availability of data that allows it to be modelled. Arriving at this balance will define the list of features that can, realistically, be modelled.
To do this requires knowledge of the range of geological features that can potentially occur, and a broad understanding of how they are defined by the data (for example, the combination of geophysical responses that permit us to identify a given physical characteristic). We need to consider also the likelihood that criteria for indirect inference of such features might be ambiguous, and that this may affect our model’s degree of certainty. The aim should be for our models to form a framework capable of holding and visualising more detailed data, as and when they eventually become available.
Chalk physics
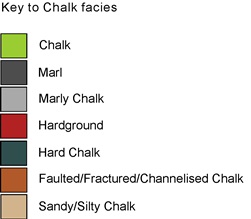
 Image, left: Boreholes such as these under London provide the raw ingredients for the 3D facies model. The boreholes are colour-coded according to different types of chalk facies. BGS©NERC. All rights reserved. 2015.
The Chalk is a relatively simple geological unit in terms of its main physical components. Publications that review its geology, such as the Geological Conservation Review Series4, show the range of potential physical properties that might be useful to record in a physical property model. These would include primary features, related to depositional history; for example: abundance/presence of flint, marl (clay-rich chalk), hard chalk, nodular chalk, hardgrounds (hard chalk formed at times of reduced rates of sedimentation). They also include secondary (post-depositional) features, such as fracturing.
Not all of these can be shown in our model – some require visual observation to confirm their presence, and including them in our model would bias their distribution to regions with outcrop, field survey, cored borehole or borehole image data. Other types of physical property might be capable of interpretation, but not in the wide range of forms observed when describing outcrops. For this group of terms a degree of rationalisation is needed, by combining several categories of feature into a single generalised characteristic (for example, combining references to ‘hard chalk’ and ‘nodular chalk’). The end result is a table of physical property types that form the core of the physical property model.
Data sources
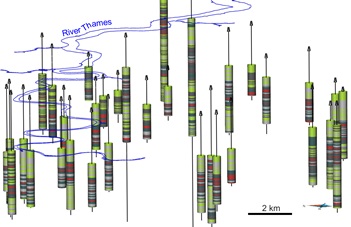
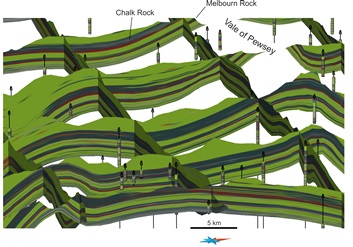 Image, right: Cross-sections through the interpolated facies model clearly showing the undulating traces of the Chalk Rock and Melbourn Rock (dark green and red colours) across the northern Wessex Basin. Vertical cylinders represent the location of boreholes which have been coded for chalk facies. BGS©NERC. All rights reserved. 2015.
Building any type of geological model requires a lot of data, and ideally that data should be widespread and evenly distributed across the region of interest. The importance of the Chalk as an aquifer means that water supply boreholes are numerous across outcrop, many with geophysical logs. Confident interpretation of these, as well as deeper boreholes drilled for hydrocarbons and coal-investigation, is permitted by cored and optically scanned boreholes, in which features such as mud content and hardness can confidently be matched to associated inflections on geophysical logs5.
There is also a lot of exposed Chalk, in coastal cliffs, large inland quarries, or in the numerous smaller inland ‘pits’ that lie scattered across Chalk downland, from which lime for agriculture and construction was historically extracted. Both boreholes and outcrop sections can function as data points for our model, each being defined by unique combinations of geographical co-ordinates and topographical elevations.
Where Chalk is particularly well exposed, for example in coastal sections and large quarries, we can deploy laser-scanning technology, allowing detailed features of exposed surfaces to be converted into 3D images (point clouds) that can be ‘draped’ with high-res digital photographs for direct interpretation of rock-properties, fracture patterns and structures.
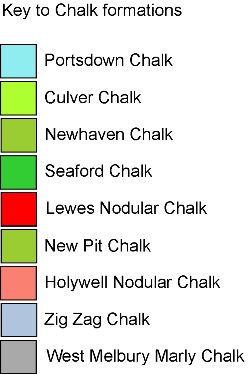
 Image, left: Three-dimensional Chalk model of southeast England with the coloured layers representing different Chalk formations. BGS©NERC. All rights reserved. 2015.
Chalk and many other geological units display ‘marker-beds’ – units that are physically distinctive and widespread, having formed in a comparatively short time. These units are often useful in correlation, but they can also be used to define packages of strata, allowing us to make high-resolution analyses of physical property distributions between selected pairs of marker-beds. In this way, relationships between thickness trends and physical properties can be assessed, and may prove useful in predicting likely patterns of physical properties in areas where few data exist.
The modern geological classification of the Chalk 1,2, 4 that has been mapped at outcrop6 and recognised in borehole geophysical logs 1,5,7 provides a vast improvement on the traditional three-fold classification. Modern digital map data for the Chalk compiled by recent BGS surveys provides detailed control for matching subsurface geology with surface topography. Areas across which obsolete Chalk subdivisions persist, or where there is particular structural complexity, are the focus of a programme of continuing field survey, to allow full integration of outcrop and modelled subsurface data.
Data-crunching
 Image, right: Cross-sections through the Chalk facies model. Setting the vertical scale at 40 times the horizontal scale exaggerates the east-west trending buckles within the Chalk created by Alpine orogenesis. Folding diminishes toward the north onto the London Platform under Norfolk and the Thames valley. BGS©NERC. All rights reserved. 2015.
The first step in creating a physical property model is to build a framework that will hold all the data, show how it is related, and be capable of performing calculations and analyses of that data. Our model has been built in GOCAD-SKUATM software, and can be thought of as a large three-dimensional cellular meshwork that is coextensive with the Chalk outcrop and subcrop across southern England.
The mesh relates to geographical and topographical data within which outcrops and boreholes can be accurately located. It is also designed to obey a set of stratigraphical rules that closely reflects how bed geometries naturally respond to geological features (such as unconformities). The mesh is cut through by geological surfaces, representing different kinds of geological boundary - including formations, members and marker-beds. Cells between these surfaces are coded to represent the different physical properties.
This last aspect – assigning physical property information – is the most difficult, because ‘real’ data only exist for the boreholes and outcrop sections that form part of the model: in this case, 380 boreholes and 150 logged sections covering the Chalk as far north as The Wash (in northern East Anglia). Physical property logs were created in WELLCADTM software and exported as simple depth-attributed digital files, with different properties translated to numerical codes. Stratigraphical and physical property interpretations of adjacent data points can be compared by selecting alignments (‘correlation lines’) of boreholes within the model, allowing the relative positions of geological and physical property boundaries to be compared, and if necessary, adjusted.
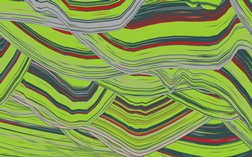 Image, left: A modeller’s eye view of the Chalk and its physical properties. Here multiple cross sections extend into the distance. BGS©NERC. All rights reserved. 2015.
An important function of our model is to predict physical properties in areas where raw data are lacking. Statistical techniques (kriging, variograms) are used to achieve this, based on assumptions about the likely lateral extents of the different physical property components.
For example, large spatial extents can be assigned to marls, because we know (from outcrop and borehole evidence) that these persist across tens and sometimes hundreds of kilometres. However, smaller extents have to be assumed for features such as hardgrounds, which tend to be localised in certain regions or at discrete geological structures.
Kriging looks at the extent to which data points close to one another are also similar in character, while Variograms describe the extent of this similarity. In essence, the variogram provides a template for determining how far real data can be projected into the model mesh, with the caveat that the extent of certain features might be limited by what is known about the general behaviour of these geological features.
Structures
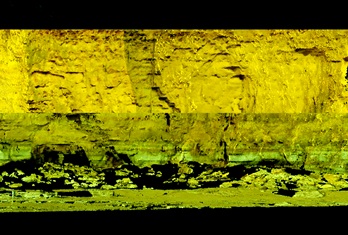 Image, right: Example of a laser-scan of coastal cliff section. Combining these scans with high-resolution digital photography provides a potentially rich source of data for physical property modelling. BGS©NERC. All rights reserved. 2015.
Folding and faulting affect many UK Mesozoic formations extensively, but are generally less pronounced in the Chalk. Despite this, much published research suggests that structural features influence the character of local and regional Chalk successions 8, 9, 10. Knowledge of these features has improved greatly with detailed formational mapping, partly because traditional stratigraphical subdivisions were simply too coarse to reveal them.
Faults are potentially an important source of physical property variation, in terms of both displacement and fracturing, as well as by influencing physical property patterns where movement took place during sedimentation, but perhaps without manifesting as discernible displacement. Consequently, structural analysis of the Chalk for physical property modelling has focused both on faults that are known to cut the Chalk as well as older Mesozoic structures that may have been rejuvenated by contemporaneous tectonism.
Folds and faults have been incorporated into the model from modern digital geological and tectonic map data, borehole stratigraphy records and published data. Cross-section analysis allows the likely geometry of these faults to be understood, and workflows within the model software allow fault planes to be converted into triangulated surfaces against which geological units can be cut and offset.
Synthesis
 When completed, our physical property model should allow us to understand patterns of variation in a number of physical characteristics of the Chalk on a broad regional scale across southern England, and allow comparison of spatial trends in these properties against stratigraphy and structure. In future, it should be possible to define broad regional ‘domains’, distinguished by particular combinations of physical property and geology, that can guide engineers and hydrogeologists in their understanding of subsurface characteristics.
The model also has the capacity to act as a ‘hypothesis generating engine’, revealing linkages between diverse types of data or flagging up unusual patterns that can be used to guide field and laboratory research. Already, simple formational thickness plots, based on high-resolution stratigraphy data used to construct the model, are providing important information about patterns of Chalk deposition in relation to basin architecture.
As new data are acquired from outcrops and boreholes, refinement of the model will increase, revealing wider potential impacts on our understanding of the processes of Chalk deposition, and allow more detailed and reliable prediction of physical properties across more tightly defined geographical regions.
References
- Mortimore, R N, 1986 Stratigraphy of the Upper Cretaceous White Chalk of Sussex Proceedings of the Geologists' Association 97, 97 – 139.
- Hopson, P M 2005 A stratigraphical framework for the Upper Cretaceous Chalk of England and Scotland with statements on the Chalk of Northern Ireland and the UK Offshore Sector British Geological Survey Research Report RR/05/01, 102
- Burke, H, Mathers, S J, Williamson, J P, Thorpe, S, Ford, J, Terrington, R L, 2014 The London Basin superficial and bedrock LithoFrame 50 Model British Geological Survey Open Report OR/14/029.
- Mortimore, R N, Wood, C J, Gallois, R W 2001 British Upper Cretaceous Stratigraphy Geological Conservation Review Series, No 23, Joint Nature Conservation Committee, Peterborough.
- Woods, M A, 2006 UK Chalk Group stratigraphy (Cenomanian – Santonian) determined from borehole geophysical logs Quarterly Journal of Engineering Geology and Hydrogeology 39, 83 – 96.
- Aldiss, D T, Farrant, A R, Hopson, P M, 2012 Geological mapping of the Late Cretaceous Chalk Group of southern England: a specialised application of landform interpretation Proceedings of the Geologists' Association 123, 728 – 741.
- Mortimore, R N, Pomerol, B, 1987 Correlation of the Upper Cretaceous White Chalk (Turonian to Campanian) in the Anglo-Paris Basin Proceedings of the Geologists' Association 98, 97 – 143.
- Mortimore, R N, Pomerol, B 1991 Upper tectonic disruptions in a placid Chalk sequence in the Anglo-Paris Basin Journal of the Geological Society, London, 148, 391 – 404.
- Mortimore, R N, Pomerol, B 1997 Upper Cretaceous tectonic phases and end Cretaceous inversion in the Chalk of the Anglo-Paris Basin Proceedings of the Geologists’ Association, 108, 231 – 255.
- Woods, M A, Chacksfield, B C, 2012 Revealing deep structural influences on the Upper Cretaceous Chalk of East Anglia (UK) through inter-regional geophysical log correlations Proceedings of the Geologists' Association 123, 486 – 499.
Authors
* Mark Woods, Andrew Newell, Richard Haslam, Andrew Farrant, Helen Smith: British Geological Survey, Environmental Science Centre, Keyworth, Nottingham, NG12 5GG. Contact: Mark Woods, corresponding author: E: [email protected].
Acknowledgements
Images of geological models have been generated in GOCAD-SKUATM software. This article is published with the permission of the Executive Director, British Geological Survey (NERC).