Product has been added to the basket

Terra not so firma

The European Space Agency’s Terrafirma project is poised to deliver a ground movement hazard information service for Europe with millimetre accuracy, say Chris Browitt1, Alice Walker2, Paolo Farina3 Xavier Devleeschouwer4 Doug Tragheim5 and Mustafa Aktar6

Geoscientist 17.6 June 2007

Figure 2. Landsliding and PSI results over Cutigliano village (Italy). Green = stability, through yellow to red = high deformation (courtesy University of Florence & TRE).Few cities and towns are without ground movement risks, and Terrafirma focuses on urban areas where its services can lead to a safer, less vulnerable environment, and save them from massive economic losses.

In Italy alone, on average, 59 people die as a result of mass movements every year and the annual cost of landsliding is estimated at between €1bn and €2bn – or c. 0.15% of its national gross domestic product over the last century. As we continue to become more urbanised and construction spills onto marginal land, the more policy-makers, planners, engineers, and the public need to be better informed about ground movement hazard.

Within two years, at least one city in every European Union country will have satellite radar coverage processed to reveal small ground movements of around 1mm per year, including landslide sites. That information will be in the hands of national geoscience centres and engineers for expert interpretation utlilising their own data and expertise. The idea is that this will lead to national initiatives for further studies within each country, and that examples will be shared across borders to ensure that the community of Europe benefits from its collective geological expertise and from the European Space Agency’s investment in leading-edge technology.

Landslides

Landslide risk can be mitigated by either prevention or by reducing vulnerability and consequences (or both). Reducing vulnerability is usually more practical than prevention, and can be done by restricting land use through zoning and/or warning systems, especially in built-up areas.

Spaceborne InSAR can provide precise measurements of the ground displacement induced by slope instability. In the case of slow movements (up to a few cm/year) affecting built-up areas, the new PSI (Persistent Scatterer InSAR) approach, first developed at the Polytechnic of Milan, is able to show the spatial distribution of displacements, and their evolution during the period of monitoring. Thanks to ESA’s archive data, the analysis of past movements can be extended more than 15 years back in time.

Figure 1 Interpolated Persistent Scatterer InSAR (PSI) image of a 900km2 area of London showing average ground velocities in mm/yr away from the satellite, indicating subsidence (red), and towards the satellite, indicating ground heave (blue).

BOX: InSAR, PSI and friends…

In the figure above the average number of PS points used is greater than 200/km2 over the five-year study period, 1995-2000 (Courtesy, NPA & TRE. .)

Synthetic aperture radar interferometry (InSAR) has been available to us for over 15 years, providing ground deformation data at centimetre precision. In the past six years, however, new ways of processing satellite radar images have been developed1 that allow ground movements to be mapped and monitored down to 1mm per year, over wide areas; thereby opening up new opportunities for practical applications.

One early example of this processing breakthrough shows a number of striking ground movement features around London over a five-year period (which also illustrates the value of ESA’s archive of radar scenes stretching back to 1992). In this PSI image of London, the blue patch indicates ground heave of 2mm/yr, where the death of papermaking, printing and brewing industries 30-40 years ago ended groundwater abstraction. Groundwater flooding of basements has been noted following the recharge.

Bottom left, parts of the Streatham area are subsiding around 3mm/yr, correlating with a lowering of the water table. Above this red patch, a SW-NE linear feature is subsidence over an electricity tunnel. Above that, a red ribbon, W-E crossing the River Thames, follows the recent extension of the London underground. At 3mm/yr, this was a level of subsidence predicted by engineers and monitored on the ground by them over the five years.

Further down the Thames, small patches of subsidence are observed along the river banks in the old docks area, which is being extensively redeveloped. The concern here is whether local subsidence increases flood risk. Further studies have been prompted by the PSI result.

The GMES Terrafirma project, sponsored by the European Space Agency, and initiated and managed by Nigel Press Associates (NPA), proposes to deliver a ground movement hazard information service for Europe, based on this new technology.

Box ends

Caption: Figure 3. Landslide inventory map of the Pomino village area, close to Florence (Italy), modified by means of a PSI analysis (courtesy University of Florence, TRE & SLAM).

Landslide inventories provide the basic information necessary for any kind of risk assessment, reporting the spatial distribution of existing slope movements and, frequently, including details on landslide typology and state of activity. At present, the most common methods are based on aerial photo interpretation, field surveys and collection of local databases. Thanks to the wide coverage of space-borne SAR images and to the possibility of measuring millimetric ground displacements, InSAR techniques are now making a valuable contribution to regional landslide mapping. The methodology adopted within Terrafirma relies on integrating ground displacement measurements over a sparse grid of points provided by the PSI analysis within a pre-existing landslide inventory map produced with conventional geomorphological tools. The main benefits include better definition of the boundaries of known mass movements, improved knowledge of their state of activity, and the detection of previously unknown unstable areas.

This approach has been developed within the SLAM project (also funded by ESA) and implemented over the Arno River drainage basin in Italy. This is the first time PSI analysis aimed at landslide mapping has been applied over such a wide area (more than 9000km2). Results have clearly shown how useful the technique is. By focusing on the urban and peri-urban portions of the basin (where the highest risk conditions are located and where the urban fabric makes it difficult to map landslides through aerial-photo surveys), 43% of previously known landslides have been significantly updated using PSI measurements. Arno Basin Authority geologists (the end users), have strongly endorsed the methodology, not only for urban areas but also during fieldwork in areas where reliable conventional investigations do not exist. Figure 3 shows an example of a landslide inventory map updated through PSI analysis.

The measurement of superficial displacements is often the most effective way of defining the behaviour of slope movements and, therefore, in predicting how it will evolve. For example, over Cutigliano village, in the Tuscan Apennines (Italy), the Permanent Scatterers technique (PSI) permitted the identification of more than 200 measurement points along the slope (Fig.2).
 
Figure 4. Velocity map obtained from the interpolation of the PSI measurements compared to in situ data. Readings courtesy, University of Florence.

These InSAR measurements were combined in a GIS environment with other ancillary data (including aerial photos, topographic and geomorphological maps) to determine the spatial distribution of movements and identify the boundaries of the unstable area. Superficial movements were integrated with deep geology (such as rupture surfaces from inclinometric readings) and stratigraphical and geotechnical characteristics (from boreholes and geophysical surveys) to understand the phenomenon's dynamics and interpret its geometry (Fig. 4). The team also made comparisons with precipitation records and identified a strict correlation between landslide activity and rainfall, showing very short time delays between the two phenomena, and acceleration phases that corresponded to heavy rainfall.

Subsidence of the Maelbeek and Woluwe Valleys

The city of Brussels, like many others, is built on an alluvial plain. The Senne valley is shown in the upper left -hand corner of Figure 5 – brown lines indicate the extension of the Quaternary alluvial sediments (late Pleistocene – Holocene) containing layers of clay, sand, gravel and peat. The image also shows two tributaries of the Senne - the Woluwe (right) and the Maelbeek (left). The Maelbeek River is almost entirely culverted as a flood defence measure. The Woluwe valley is also affected by flooding after heavy rain but the area is less urbanised and contains several ponds.

Caption: Figure 5. Kriging interpolation on the Maelbeek (left) and Woluwe (right) rivers in the eastern part of Brussels. Black dots correspond to peat layers. Brown lines delimit the extension of alluvial Quaternary deposits.

Figure 5 shows the result of a geostatistical approach, using an experimental variogram based on 25% of the 48,522 PS points present in the area. This high density of PS data implies that around 12,000 PS were used to create the model, generating a 25m-resolution grid calculated by ordinary kriging. This interpolation technique shows positive (blue = uplift) or negative (red = subsidence) annual average velocity values in mm/year. The interpolation clearly reveals two lineaments characterised by subsidence (yellow - red). One lineament with a NS direction corresponds to the Maelbeek valley and matches the Quaternary alluvium. In the southern part, subsidence follows two directions (red patches). The left patch follows Quaternary alluvial deposits, but the right subsidence patches could indicate the presence of uncompacted Quaternary alluvium not recorded in published data.

The second lineament is oriented SW-NE and corresponds to the Woluwe valley. Red patches, indicating the strongest subsidence values along the Quaternary alluvial deposits, agree relatively closely with known peat layers (black dots) detected in boreholes. Peat thickness ranges from 10cm to 6m. Subsidence patches are also observed where no Quaternary alluvial deposits are recognised - e.g., in the centre of the image, related to the Woluwe valley. The subsidence ring may represent an abandoned meander.

Mineral Extraction, Stoke-On-Trent (UK)

Stoke-on-Trent and the nearby towns comprising "The Potteries" were also well known for iron and steel manufacture - industries based on the local clay, ironstone and coal. To the northwest lies the UK's largest halite field where salt extraction continues today.

Industrial heritage, combined with phases of tectonic stressing and de-stressing that have continued throughout its history, has resulted in ground movements ranging from a few millimetres to as much as two metres in the worst affected areas2.

In the Terrafirma project, PSI data for an area of 1111km2 were analysed. This enabled the identification of 178,109 permanent scatterer (PS) points (Figure 6) of which 68 509 (38.5%) had a full linear velocity history. The data obtained were compared with a range of spatial geoenvironmental information to try to identify the causes of the observed ground movements between 1992 and 2004.

Caption: Figure 6. Permanent scatterer points (in yellow) displayed on a false colour (bands 4-5-7 in RGB) Landsat image. Reference point shown in red.

A map of these PS points, colour-coded to show subsidence (red) and uplift (blue) in relation to the reference point, is shown in Figure 7.

Figure 7: Stoke-on-Trent map of PS points colour-coded to show subsidence (red) and uplift (blue) in relation to a reference point. The environmental legacy comprises:
  • Coal mining subsidence. As underground mining has ceased, this kind of subsidence has reduced. However, underground mining was still active for much of the period for which PSI data was available (1992 to 2004). This is particularly true in the southern part of the Potteries where mining did not end till 1998.
  • Minewater rise. Once a mine is closed and pumping ceases, groundwater returns towards its historical level. As water levels rebound the ground surface may also rise. In the northern part of the coalfield mining ceased decades ago and water levels have presumably risen considerably.
  • Fault reactivation is associated both with active mining and the post-mining stabilisation and recovery period. Donnelly & Rees2 studied this in the Potteries and recorded substantial ground movements of many hundreds of millimetres.
  • Salt extraction subsidence. Salt is still extracted by controlled pumping in the Cheshire Basin. Subsidence is continuing.
  • Dereliction and the presence of made ground may cause ground movement as a result of poor compaction and chemical reactions. 
  • Infilled quarries/waste disposal sites are subject to movements as materials settle producing subsidence; or decay, producing methane and temporary heave. 
  • A few landslides have been mapped in the Potteries, showing lateral and vertical ground movements.
  • Compressible valley alluvium. Some river valleys are infilled with weak, compressible alluvial deposits. Settlement is likely due to both self-compaction and artificial loading (e.g. from foundation loads).
The results of these interpretations3 suggest:
  • Uplift, in the north seems to be associated with the area of older partial extraction mining in the northern Potteries, and where groundwater levels have rebounded.
  • Subsidence was observed in the southern Potteries where deeper (total extraction) mining ended in the last decade. 
  • We note that this difference in surface response (recently mined areas subsiding, older areas rebounding), has also been seen in the Liege area (Belgium) following PSI processing in 2006.
  • Additionally, subsidence is associated with areas of landfill (though subsidence varies with the age of the infill).
  • A "compressible soils signature" has been observed in uplifted regions underlain by compressible soils, where uplift has been consequently moderated.
  • Seismic activity (very low magnitude) correlates well with uplift.
  • There is good spatial correlation between PSI-derived subsidence and extensive non commercial rocksalt deposits, probably undergoing natural solution.
  • There is no obvious spatial correlation with areas prone to shrink-swell, running sand or slope instability.

The result of the work at Stoke-on-Trent shows that, overall, the PSI technique is a potentially powerful tool for identifying and monitoring ground movements at local, regional and national scales. Combined with environmental geological spatial information, it is possible to identify the likely causes of observed ground motions. The technique would seem to have many applications for those charged with managing the urban environment and the service infrastructure of roads, railways, pipelines etc.

Ground Vulnerability Mapping

Since Terrafirma started in 2003, radar satellite data for many cities - from Dublin to Haifa and Moscow to Sofia - have been used to map ground movements, exploiting the 15-year archive of raw information held by ESA. Istanbul, with its great building heritage, 10 million population and vulnerability to large earthquakes, has been a particular focus of attention.

Istanbul's long history of earthquake damage relates to the North Anatolian Fault that passes only a few tens of kilometres away beneath the Sea of Marmara. During the last 500 years at least eight earthquakes with magnitudes greater than 7, have occurred close to Istanbul - causing high casualties and great damage. Recent studies show that the probability of an earthquake greater than 7 affecting Istanbul within the next 30 years now stands at 53%.

Rapid population growth (10-fold in the last 50 years) has resulted in hastily constructed new building stock that often does not comply with required standards. About 65% of the total building stock does not satisfy current codes.

Following the magnitude 7.4 Izmit earthquake in 1999, considerable effort has been devoted to assessing risk in urban areas. Istanbul Metropolitan Municipality has taken the initiative with an extensive micro-zonation project that will eventually cover the entire metropolitan area. Satellite and ground-based techniques will be integrated, including a drilling campaign, including PSI results produced by GMES Terrafirma.

New PSI studies have yielded a subsidence map (Figure 8) showing how spatially variable ground conditions are throughout urban Istanbul. Thirteen years' worth of observations not only show general trends that correlate well with the local geology, but also help to reveal other characteristics at smaller scale that would otherwise have gone undetected.

Caption: Figure 8 – Effective Subsidence map of Istanbul derived from PSI data. Green = stability, grading through yellow to red = high subsidence areas (courtesy, TRE & Terrafirma).

This subsidence map covers 50 x 30km, and shows a striking pattern of widespread subsidence in the western city (red area, contrasting the green). This corresponds to rapidly urbanised areas of the last 20 years, built on smooth, young sedimentary ground.

By contrast the eastern city, including the historic district, is built mostly on solid rock and is generally stable - though critical zones are revealed by the PSI study (see below and Figure 9). Average subsidence of 2-3 mm/year detected in the western part is probably due to consolidation and compaction triggered by extensive water pumping. This is a clear sign of unconsolidated soft sediments that can severely amplify seismic ground motion. In fact, much of the destruction caused by the Izmit earthquake was concentrated to the west of the city, even though the epicentre was well to the East.

Figure 9 – Detail of PSI subsidence data (red) revealing vulnerable soft foundation geology in the ancient river channels and coastal embayments of Istanbul (courtesy of TRE & Terrafirma). 
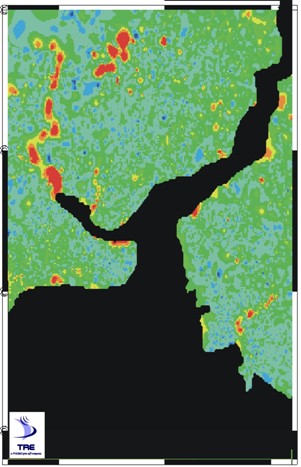
The PSI study of eastern Istanbul shows only very local subsidence, but picks out ancient riverbeds and coastal fills (Figure 7). Ancient riverbeds are abundant because the region has experienced sequences of rapid uplift and inundations during the recent geological past, leaving behind deep, narrow gorges filled with coarse gravel and sand. These riverbeds are barely reflected in actual topography, and in most cases are completely hidden below the modern city.

Conclusions

The GMES Terrafirma project is yielding examples from across the European-Mediterranean region, which show the dramatic contribution that PSI can make to understanding ground movements that threaten urban communities. The potential for extensive mapping and follow-up monitoring, over wide areas at low cost, is a breakthrough which can make a difference to reducing risk through planning and mitigation measures, when coupled with surface-based geological and engineering expertise, and data.


Acknowledgements

The authors would like to thank the Terrafirma Project Core Team, led by Nigel Press Associates (NPA), Tele-Rilevamento Europa (TRE) for the PS processing, and the European Space Agency (ESA) for its sponsorship of the project, and its radar satellite data. BGS contributions are published with the permission of the Executive Director of the British Geological Survey. The European Federation of Geologists (EFG) and EuroGeoSurveys (EGS) are also partners in the project.


References

  1. Ferretti, A, Prati, C, and Rocca, F, 2001 Permanent scatterers in SAR interferometry IEEE Transactions on Geoscience and Remote Sensing, v 39, p 8-20, doi:101109/36898661
  2. Donnelly, LJ & Rees, JG 2001 Tectonic and mining induced fault reactivation around Barlaston on the Midlands Microcraton, North Staffordshire, UK Quarterly Journal of Engineering Geology and Hydrogeology, 34, 195-214
  3. Culshaw, M, Tragheim , D, Bateson, L, & Donnelly, L, 2006 Measurement of ground movements in Stoke-on-Trent (UK) using radar interferometry IAEG 2006 , paper number 125

Visit: www.terrafirma.eu.com

1 Edinburgh University, West Mains Road, Edinburgh, UK, [email protected] 2 British Geological Survey, West Mains Road, Edinburgh, UK, [email protected] 3 University of Florence, Florence, Italy, [email protected] 4 Geological Survey of Belgium, Brussels, Belgium, [email protected] 5 British Geological Survey, Keyworth, Nottingham, UK. [email protected] 6 Kandilli Observatory, KOERI, Istanbul, Turkey, [email protected]