Greg Power & Rob Barnes* use IT to mine old data collected in the Central Wales Orefield, all from the comfort of their armchairs.
 After a lifetime of accumulating geological information it is sometimes difficult to let it go. Retirement is a particularly critical time, but it also offers new opportunities. When retirement eventually befell one of us (GMP) he retained an interest in a large dataset from central Wales that he had accumulated with 20 generations of students, little realising the new interpretations that might be extracted.
Fig. 1. Oblique view of Cwmystwyth Mine.
That had to wait until a chance contact with an old friend (RPB), when we were able to explore the data more fully using Geographical Information Systems (GIS) technology. Gradually it became apparent that modern methods of data exploration could be applied profitably to the dataset, partly through the application of modern GIS systems but also using the astonishing range of products freely available for information visualisation and sharing. We feel that this example may encourage others to avail themselves of such techniques.
DATABASE
The dataset in question comes from a series of 25 separate exploration geochemistry stream-sediment student-training surveys made within central Wales from 1979 to 2003. Each had been interpreted separately at the time it was carried out. Now they have all been compiled into one large database, so that regional variations may be observed (open access files at www.geologis.com).
For our purposes the data have been processed within a GIS, and to some extent this remains a necessary precursor; but here we would like to illustrate the use of Google EarthTM overlays, which offer some unique features. Google EarthTM is free and plenty of information is available on how to use it with your own data. The symbolisation capabilities present some limitations, but for point data bespoke 'placemark' symbols may be easily created. Research areas or individual sites worldwide may be examined at various scales using Google EarthTM imagery. Much of the UK, even the depths of central Wales, is covered by the ground-level imagery of Street ViewTM, so that an excellent investigation of some sites may be achieved without straying from one's computer. The armchair geologist may now, in retirement, do more than merely reminisce!
OREFIELD
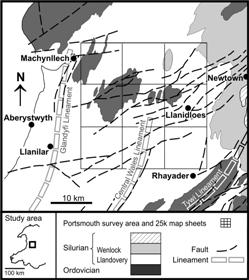
Fig. 2. The survey area.
The central Wales orefield was an important source of lead, silver and some zinc and copper during the 19
th Century, extraction taking place from many small mines and a few larger mines such as Cwmystwyth, <Fig. 1> (Pb ore: 33,439 tonnes; Zn ore: 19,216 tonnes; Ag: 33,509 oz). James
1 gives an excellent review of the orefield’s geology, and a well-argued model for the mineralisation process. <Fig. 2> The area includes some isolated and elevated terrain and the sources of the rivers Severn and Wye.
The exploration geochemistry course at the University of Portsmouth used the area for stream sediment survey exercises. The market town of Llanidloes provided a base from which nine 1:25,000 topographic map sheets covering much of the orefield could easily be reached. Each of the annual surveys investigated one of these sheets. Teams formed of two or three undergraduates were allocated 10km2 from which to collect about 30 stream sediment samples in the two collection days of the field course.
Team members prepared and analysed their own samples by atomic absorption spectrophotometry (AAS) for Fe, Mn, Pb, Zn, Cu and from 1989, Ag. Each student had to prepare an interpretative report on the complete set of results for the whole map sheet. Thus they gained experience of teamwork in field and laboratory, as well as in interpretation and report-writing.
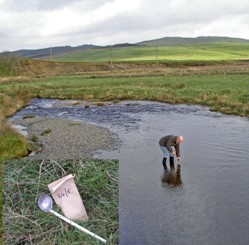
Fig. 3. Sampling, inset: sampler and sampling bag.
In the early years, results were calculated using pocket calculators and interpretive maps were drawn by hand. Much ingenuity was used to display the data in the most readily understandable way. With the advent of computer networks data could be exchanged and compiled more readily. A dedicated programme was written in Quick Basic as a project by a computer science student to display the data as a series of instant geographical maps for data exploration and this was used extensively for report production. Spreadsheets and statistical packages also became available so that the application of techniques such as principal components analysis could be tested.
Google EarthTM Displays
The capabilities of Google EarthTM may be demonstrated by using the stream sediment data for silver, a useful indicator for lead mineralisation as well as valuable in its own right. The distribution map <Fig. 4>, covering the whole of the database area, classifies silver concentration in samples as: 'Background' (Ag <4 mg/kg), blue; 'Anomalous' ( Ag 4 -11 mg/kg), yellow; and 'Probable mine contamination' (Ag>11 mg/kg), red, circles. Old mines (white cross on circle) and the main faults (black lines) have also been added as overlays.
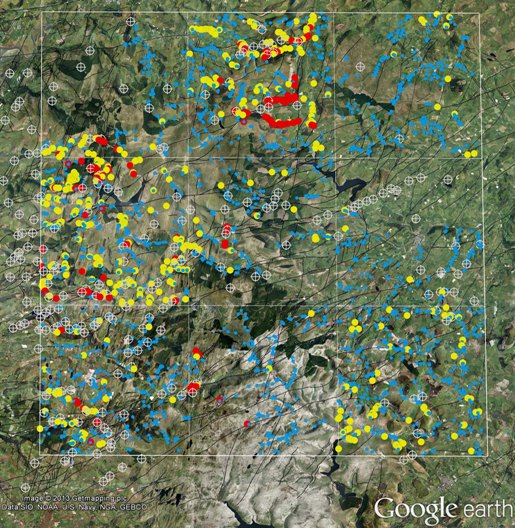
Fig. 4. Distribution map for silver for the whole survey area. Geological overlay © Crown Copyright/database right 2013. A British Geological Survey/EDINA supplied service
These digital data, produced by the British Geological Survey, are accessible to registered academic users through the EDINA service of the University of Edinburgh. At the relatively small scale of the whole study area the uneven distribution of the mines, exploiting mineralisation primarily developed in association with the faults, may be clearly seen. The contamination from old mines is also very obvious. More detailed examination may be achieved by increasing the magnification of the image for selected parts of the area.
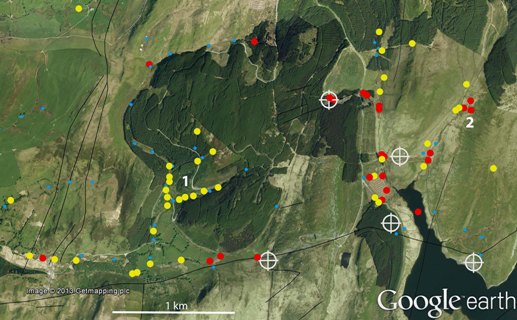
The area NW of Nant-y-Moch Reservoir is shown <Fig. 5> as an example of this, using the same symbols. There are clusters of Ag values greater than 11 mg/kg around some of the old mine sites and sometimes trails of these 'mine contaminated' values continue some considerable distance downstream. Sites 1 and 2, however, show interesting clusters of 'anomalous' Ag values that might prompt further investigation.
Additional geological information may be added as overlays <Fig. 6>. For example, the potential productivity of the Derwenlas Formation is known from old mining records and this unit has been coloured in a bedrock overlay superimposed on the map. Also shown are: lead values, 'Background': (Pb <220 mg/kg), small pale blue circles; 'Anomalous' (Pb 220-740 mg/kg), larger dark blue circles and 'High' (Pb >740 mg/kg), pale blue 'washers'. The anomalous lead values of site 1 are seen to be associated with the Derwenlas Formation, which might increase the interest in this particular anomaly. Unfortunately the publication of Street ViewTM images is restricted by copyright but interested readers may use their own copy of Google EarthTM to 'drive past' site 1 to establish that there is no visible evidence of previous mining activity.
 O T Jones
Fig. 5. Area NW of Nant-y-moch Reservoir (bottom right). Geological overlay © Crown Copyright/database right 2013. A British Geological Survey/EDINA supplied service
A further overlay, showing the outcrop traces of mapped mineral veins in red, has been added and the alert reader may notice that now, site 2 has gained a 'former shaft' symbol. We discovered on reference to the classic work by O T Jones2 that a trial excavation (called ‘Cwmdwrbach’) was made there in 1904 but was abandoned after only yielding a total of 26.4 tonnes of zinc blende. The stream sediment survey has picked up the evidence for the contamination caused by the small spoil tip left at the site, itself visible in Google EarthTM.
Overlays may also be drawn in Google EarthTM to show possible interpretations. For example, orange lines have been added at sites 1 and 3 to suggest potential mineral veins from the anomalous silver and lead values and the orientation of the stream valleys following the general trend of known mineral veins in the region.
AONB
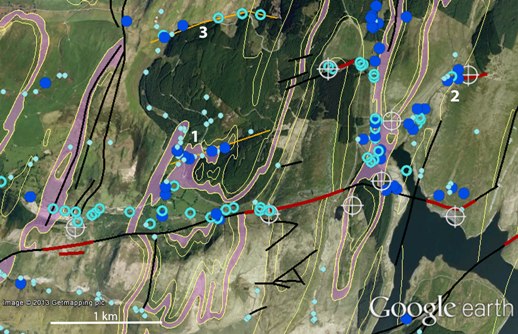 Fig. 6. Overlay of Derwenlas Formation and Pb values. Geological overlay © Crown Copyright/database right 2013. A British Geological Survey/EDINA supplied service
Open-ended investigations of this database, or its use for teaching, may be carried out by downloading the data from www.geologis.com. However if you feel that you may have located a new prospect for mineral exploitation be warned that in this Area of Outstanding Natural Beauty (AONB) it is unlikely that permission would ever be granted to restart mining!
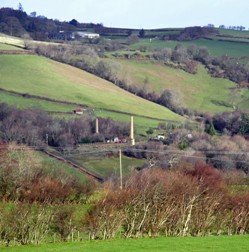
Much work has been done to mediate the contamination from the old mine sites. For example the Van mine <Fig. 7>, one of the largest producers in the orefield (Pb ore: 98,287 tonnes: Zn ore:28,788 tonnes and Ag: 756,142 oz) is now gently reverting into, and becoming part of, the landscape following considerable remediation efforts.
Fig. 7. Van mine.
 References
- JAMES, D M D 2011. Turbidite pathways, pore-fluid pressures and productivity in the Central Wales Orefield. Journal of the Geological Society of London, 168, 1107-1120.
- JONES, O T 1922. Lead and Zinc. The mining district of north Cardiganshire and west Montgomeryshire. Memoir of the Geological Survey, Special Mineral Resources of Great Britain, 20.
* Dr Rob Barnes is a Director of GeoloGIS Ltd. a Geoscience and GIS consultancy based in the Scottish Borders. E: [email protected]. Dr Greg M Power, formerly of Portsmouth University, may be contacted at E: [email protected].