Review and comments on the BBC Programme, “Operation Iceberg”, first broadcast in October 2012
By Tom Power*
 Last year was the centenary of the Titanic disaster and the BBC produced a programme in two parts on the life of ice bergs. As well as the historical content, it was most apt, as the research into global warming since 2000 has thrown new light on the formation of ice bergs and the mechanisms which are evoked in the melting of ice sheets. More than that, it has been difficult to apply James Hutton’s principles of uniformitarianism to Quaternary geology because of the fundamental lack of evidence from present day ice sheets. This paucity has arisen because of the remoteness and the risks involved in getting close to ice sheets.
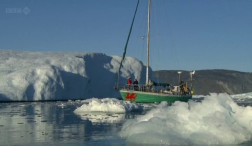
Picture: The survey yacht Gambo
The observations made during the programme may help in going some way in providing new light for the study of Quaternary geology. As Michelle Koppes indicated in the programme, there is more known about the surface of the Moon than the processes occurring with melt water below the surface of the glacier. Most programmes, dealing with science, are designed to entertain and inform the general public of scientific understanding. This programme was different in that very new scientific ideas were being tested “on the hoof” and hence the results and observation will be new to most earth science specialists and therefore of more than general interest.
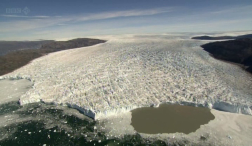
Picture: Store Glacier, West Coast of Greenland. An area of warm turbid ice free water in front of an embayment exists: evidence of warm water issuing from an underwater melt water channel.
The programme concerns itself with an expedition to the west coast of Greenland by a team of scientists, cameramen and support personnel, to investigate the formation of icebergs by the Store glacier.
The Store glacier has a front, 8km wide, stretching between ice free headlands. The cliff at the glacial front varied in height from 100 to 120m above sea level. On the northern headland the group had their base camp; spending three weeks there. The base camp of the expedition was often plagued by mosquitoes, which bit the team members relentlessly: another hazard of exploration in this area.
The team included the following scientists:
- Helen Czerski, University of Southampton,
- Allun Hubbard and Nolween Chauche, Aberystwyth University
- Richard Bates, St Andrews University
- Jason Box, Byrd Polar Research Centre University of Ohio USA,
- Michele Koppes, University of British Columbia, Vancouver Canada,
- The lead tv presenter was Chris Packham and the team had the benefit of a helicopter and a small research vessel the “Gambo”
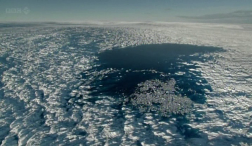
Picture: A blue lake or melt pond on the surface of the glacier
The group set themselves a number of tasks. These included determining the speed of the glacier at the front, the submarine profile of the ice and sea bed using sonar side scan and the depth temperature profile. On the surface of the glacier the team’s task was to investigate the occurrence and quantity of melt water and its subsequent dispersal, linked in particular to the occurrence of blue lakes (melt ponds) and moulins; vertical shafts in the ice formed by melt water.
The speed of the glacier’s front was determined using a GPS station. Allun Hubbard, was air lifted on to a pinnacle of ice nearly 100m high at the ice front, where he fixed the recorder. This yielded information on movement until the pinnacle collapsed into the sea several days later. The readings showed an average of 25m/day, with considerable variation between the maximum and minimum diurnal readings. The minimum diurnal value was less than 10m/day and the maximum 50m/day.
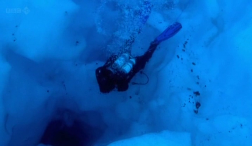
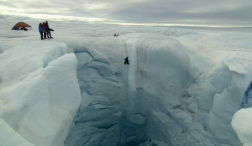
Picture: A diver enters a sink hole at the bottom of the blue lake
It can be estimated from the readings that the glacier delivers to the sea some 15 billion tons of ice to the sea each year. It was felt that the movement of the glacier, had to have an explanation beyond gravity and this was likely to be due to melt water penetrating deep into the ice sheet to “lubricate” the base of the ice. The programme can be criticised for using the term “lubricate” as it can be envisaged as reducing the surface friction, in the way oil does.
Anybody involved in a car skid on a icy road would know, the surface of wet ice is almost frictionless. However the presence of melt water at the base of the ice sheet does imply an increase in temperature which would melt the basal ice and an increase in hydrostatic and pore-water, pressure at this point with a corresponding increase in the forces inducing sliding. The greater the free head above the base, the greater the movement. It has been observed by Howat et al (2010) that as the blue lakes begin to drain towards the end of the summer, the movement of the ice sheet slows.
On the surface of the glacier, at a distance ranging to more than 15km from the glacial front there were pools of water; known as blue lakes (or melt ponds). Store has seven of them. They measure up to a kilometre wide and are derived from surface melt waters, delivered to them by channels. They form in the spring but by late summer they have disappeared. Jason Box stated, it was already two days past the average time of year when the lakes would disappear.
Michelle Koppes stated she hoped to discover the destination of the water in the blue lake and the route taken.
A time lapse camera was fixed on solid ice overlooking the blue lake and two divers entered the water in order to fix a depth gauge and to explore the bottom of the lake where sink holes are in evidence. This, as far as it is known, was the first time that a blue lake had been dived. The water was incredibly cold and as well as the danger from the bottom of the lake opening up into a giant sinkhole, the cold caused the air hoses of one of the divers to be block by ice. A deep sink hole was penetrated by one of the divers but when it became too narrow he gave up the attempt. A rising plume of water out in the middle of the lake; then made the party wary and diving was terminated.
Over a course of a week or more the time lapse camera and depth probe showed the amount of melt water present in the lake had increase enormously, nearly overtopping the camera. There was little doubt that there was sufficient melt water in the lake to increase the forces needed to move the 4000 billion ton glacier. On the time lapse footage, small pieces of ice could be seen moving across the lake surface. These were called “speed birds” by Jason Box. According to the depth probe, the rise in water level was fairly even but it did slow down in the last few days. Helen Czerski gave a figure of 7m for the total rise. The team calculated the volume for just this one lake as just over 5 million cubic metres of water. With the inclusion of the other blue lakes, the team suggested there would seem to be ample water to move the whole of the glacier and create icebergs. Water drained down shafts into the heart of the glacier. When it reached the bottom, it enabled the ice to slide.
Jason Box stated that the embayments along the ice front, often had minor iceberg calving but the headlands of ice produced larger icebergs but on a much less frequent scale. These larger icebergs are known as megabergs. To investigate further, the team’s yacht was used to explore the submerged front of the glacier. With the active calving of icebergs, this was sometimes hazardous.
The yacht had side scan sonar installed on board. This was used to profile both the seabed and the submerged ice front, working at a distance of between 100 to 200m from the ice. The images on the monitor screen showed the sea bed was at 400m down and the ice had a vertical face. Nolween Chauche, added that the maximum depth was about 500m. Chris Packham made the observation that the submerged part of the glacier was four times the height at the maximum depth. In a few places the ice front went all the way to the bottom but over most the face it was undercut at a depth of 150m or more.The commentary suggested that the front of the glacier became unstable because of the buoyancy of the ice above the undercut and this explained why unstable blocks are prone to rise up before collapsing.
Following the side scan sonar, the yacht returned to survey the water depth temperature profile in slightly deeper water further out to sea. In front of the monitor screen Nolween Chauche reported that the surface water is relatively warm but did cool down quickly to just above 0 deg at a depth of no more than 100m. It then increases in temperature to a depth of about 400m where a temperature of 2.7 deg was recorded. From this depth to the depth to the seabed at 800m, the water is at a constant temperature of 2.4 deg.. The warmer water is melting the base of the ice to increase the size of the undercut and hence instability.
Climate change could increase the production of ice and melt water at the front. Jason Box estimates that there has been a net loss of 300 billion tons of ice per year from the Greenland ice sheet over the last 10years. This is enough to produce a sea water level rise of 1mm per year but it may not be entirely linear and by the end of the present century the seal level could have produce a rise of between 1 and 2m.
Midway through the exploration, calving on the ice front produced a large iceberg with a 10m high splash wave radiating out to sea. This iceberg was estimated at 140million tons of ice (500m block). The occurrence of large megabergs did require more investigation and the team returned to look at the way melt water is dispersed from the surface of the ice: and in particular the shafts, carrying meltwater, known as moulins; a name which reflects the way water grinds its way vertically downwards. Michelle Koppes was a little sceptical that the melt water could reach all the way down to the bedrock. It was reported that a camera had been lowered into a moulin elsewhere and had reached a depth of 100m without finding the bottom.
Picture: An abandoned moulin or drainage shaft on the surface of the glacier, with a descending climber.
 Some of the existing shafts did not carry any meltwater and were available to explore. One shaft 8km from the front was selected. Climbers and cameramen were lowered into the moulin. Andy Torbet, one of the climbers, reported that there were unstable ice blocks in the walls and the face was drenched in icicles and snowflakes. As Andy Torbet was nearing the bottom of the moulin, he reported to the surface that there were blocks of ice as large as cars on the floor which had fallen from the sides above. On one side of the moulin, a side tunnel occurred that went away horizontally from the moulin. He reported that the height was comparable to two double decker buses i.e 12m. The tunnel must have channelled vast amounts of water towards the front and proved that not all the moulins reached the bottom in a straight drop.
With the constant movement of the ice, it was felt that the sides could become unstable at any time. A rumble was heard coming from deep within the moulin before the climbers started to descend and then a second rumble was heard from the side tunnel. This left the roof cracked and made it unsafe to continue and prompted the climbers returned to the surface.
The melt water channels could be envisaged as following a staircase going alternatively vertically then horizontally until the bedrock or the glacial front is reached although there is geological evidence as will be discussed to show that there might be tunnel sections of upwardly flowing meltwater. The lines of drainage may be significant in the creation of megabergs.
The study of these en-glacial drainage channels prompted an experiment using small slightly buoyant water tight plastic balls, the size of ping pong balls or cryospheres. They were full of electronics with the aim of recording the course of the flowing melt water. In all thirty were released into melt water channels at the surface before the channels drained into moulins. The balls were expected to flow to the ice front where they would be recovered. The search at the ice front was enhanced by the use of telescopic imaging systems which sought out the orange colours of the cryospheres in the sea at the ice front. Unfortunately this was not successful and not one ball was recovered.
Although the search for the balls failed, the observers on the Gambo noticed features in the water which may locate the outflow points of meltwater at the ice front. Chris Packham commented that the sea in specific areas adjacent to the ice, was ice free and turbid, and there were upwelling waters in plumes breaking the surface. Alan Hubbard suspected they were fundamental to the processes occurring at the ice front.
Imaging expert Richard Bates on board the Gambo started to analyse the 2D sonar side scan data to produce a 3D model. When he had finished, this showed the topography of the sea bed and the ice front. The undercuts could be easily seen and appear to be located mainly at the base of the ice in the embayments, where the ice free water and plumes of turbid water had been observed.
Alan Hubbard thought that the melt water channels and plumes melted the ice in particular locations to form deep embayments leaving large promontories relatively untouched but isolated. These eventually calved as megabegs on to the sea.

Picture: Calving of a massive iceberg known as a megaberg, taking away a headland in the glacier’s front.
While the team was preparing to return home, an entire promontory collapsed and a massive ice berg was launched into the sea. This megaberg was the largest the team ever saw during their three weeks stay. It was estimated at a kilometre across by one of the observers. The original face of the ice front could be seen to crumble away, remarked another.
At the end of the programme Chris Packham wondered where the iceberg that had just calved, would be, when it finally melted. The life of the iceberg on the sea was the subject of part 2 of the programme which has not been reviewed.
Part 1 of the programme as a whole was extremely interesting and presented the new evidence on glaciers and ice sheets well. However, as the programme was for the general public, it often concentrated more on the risks and dangers involved than the scientific aspects. Some obvious points were overlooked; the darker colour of the blue lake meant that these retained more of the heat from the sun, than the white highly reflective surface of the ice sheet and the figure for the amount of melt water dispersing into the moulins was not given. The speed of the upper glacier was also not given although it is evident, it would be much slower than at the front. Tension therefore must exist in the glacier with resulting crevasses or fractures traversing across the glacier.
The crevasses might be deep enough to intersect the bedrock and provide direct access for any melt water in horizontal tunnels, to reach the bottom or conversely rise up into the crevasses. The rising plume in the blue lake may represent melt water flowing into the lake from englacial tunnels coming from higher up the glacier. The plume of uprising meltwater may explain the rapid rise in the water level of the lake. It is clear that the meltwater in the englacial tunnels will lose heat to the surrounding ice until it freezes again blocking the tunnel, and causing the flow to back up and possibly allowing the meltwater to break through to the surface again. Crevasses would considerably aid this process.
The figure of 100m high cliff of ice over 400m of submerged ice is a little contrary to the 1/9th quoted for solid ice floating in water. The density of sea water is somewhat higher than fresh water but this only explains a small part of the discrepancy; the difference may be the voids in the ice formed by tunnels and the undercutting of the ice blocks.
According to Howat et al 2010, the disappearance of the blue lakes (melt ponds) towards the end of the summer, probably corresponds with the drainage of the melt water from the ice front and the diminished speed of the glacier. Observations have related a reduction to 60% of the peak velocity, to the disappearance of surface lakes in late August.
Landsat imagery on Google Earth web site for 10th April 2013 show that there are sizeable blue lakes with widths of 1.4km, up to 25km from the ice front, with some smaller pools beyond.
The spacing i.e 1 to 2km between the main sets of melt water tunnels in the ice sheets is probably related to the ability of the ice sheet to bridge over tunnel systems where they have eroded the bedrock.
Comments on the possible significance for British Quaternary Geology
There was some debate in the programme whether the moulins would touch the bedrock. If water in the moulin, fell from some distance, an enclosed basin would be formed similar to basins forming below waterfalls. There could be similar features in the British Quaternary landscape that have originated from moulins. A Woodland (1970) in his paper on the buried tunnel valleys of Eastern England identified many enclosed basins from well records along the present river valleys. Woodland commented on the marked hydrostatic head on water within an icesheet, giving rise to characteristic up and down trough and sill long profiles. The fact that some tunnel shafts were found high in the ice front at Store may be direct evidence of this.
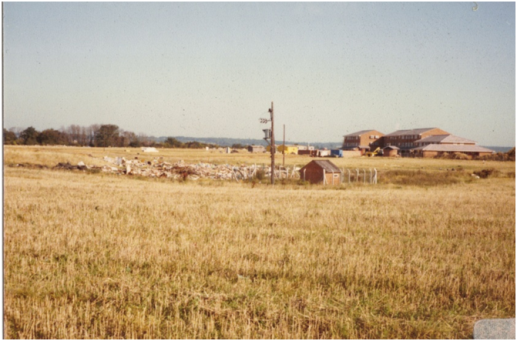
Picture: A sink hole at Panshanger passing through boulder clay . The electrical substation is less likely to collapse in the centre of the depression, than it would have been, if it had been built on the rim.
The unusual feature at Wing Leicestershire recorded by Alan Hall 1976 is an enclosed basin which has steep sides and a V shaped profile and a depth of 18m. He thought on balance, the feature was ice eroded. This might be doubtful. Water falling in a moulin offers a better explanation. What is clear is that the feature occurs directly in the middle a ridge between two parallel valleys and contains unweathered sides and infill of fresh material derived, from the Jurassic beds above the ironstone, and the chalky boulder clay. The limestone and ironstone beds of the Inferior Oolite, which are at the surface, had to be eroded away quickly, and by a strong erosive force such as water falling from a great height.
In the London Basin there are a number of infilled holes stretching down into the Upper Chalk known as scour features. They were encountered in the construction of the Jubilee Line and other works. (Wakeling and Jennings 1976). As there is a reasonable thickness of London Clay in these areas, moulins offers a possible explanation but they may also have resulted from high hydrostatic pressure existing below the London Clay, producing “blow holes”; erosion having removed part of the London Clay cover.
At Panshanger. Welwyn Garden City. large sink holes exist in the area where boulder clay is found filling the original proto Thames channel. These sink holes have developed very wide surface depressions from the water in the sand above the boulder clay. Boreholes do show that there is a central connecting hole through the boulder clay into the Kesgrave Sands which lie directly on the Upper Chalk; but boreholes drilled only 4 to 5m away from the centre, encountered the boulder clay at the level met with elsewhere on the site. The boulder clay layer appears to have remained unaffected by any subsidence from below. The creation of these holes by melt water falling through the ice in moulins, could be a likely prospect.
At Mimshall, Herts, and along the River Mole in Surrey there are active sink holes in the river beds, where large amounts of river water disappear into the holes. They suggest that pipes and sink holes must have formed by water erosion including abrasion as well as solution. In the Chilterns, the interfluvial ridges of the south east flowing rivers and streams form a dissected plateau on the Upper Chalk. The ridges are generally covered by drift consisting of clay with flints and pebbly drift. Numerous pipes occur at the base of the drift deposits but not on the slopes below the drift. To explain this occurrence West et al (1972) postulated the plateau surface is peppered with pipes and sink holes which are revealed by the removal of the drift material by erosion.
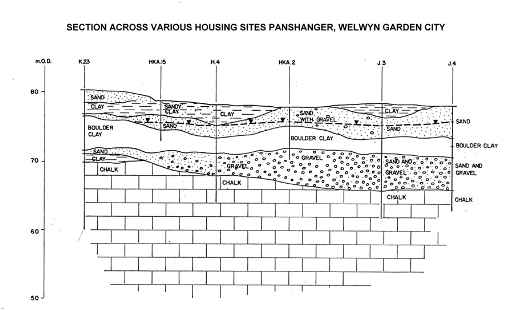 Diagram: Panshanger. Borehole information from various site investigation reports.
Higginbottom et al (1970) postulated that periglacial activity and melt water played a significant part in their formation and West et al thought that, given time, solution by percolating rainfall of the smaller pipes could be possible, but they also expressed the possibility of other mechanisms being involved. Direct erosion from falling water in a moulin within an ice sheet may also be a possible origin. However this would require the present drainage pattern to have been superimposed from the ice sheet.
With warming, the present and recent studies have shown that the ice front would retreat in the opposite direction of the melt water drainage gradient. The ice front at Store could retreat up the glacier until the base of the ice was on land above sea level; it would then start to produce a series of parallel drainage valleys spaced at a distance of between 1 to 2km along the line of the tunnels in the ice. Leighton (1958) recorded such systematically spaced parallel valleys on the boulder clay left by stagnant ice in Illinois. Similar drainage patterns are present in East Anglia and in eastern England to the west of Stamford, where Chandler (1976) considered the drainage pattern to be essentially post glacial in age. The traditional view, however, is that this pattern is pre-glacial and was re-excavated after the retreat of the ice and this might still be true for the larger rivers and for rivers with courses different from the main trend. Even so the Bytham Channel and the proto-Thames channel in Essex, the largest elements so far identified in the definite pre-glacial drainage of Eastern England, did fail to re-excavate their old courses.
* Tom Power is a retired engineering geologist, formerly of Laing Orouke Plc
References
- R Chandler 1976 “Lias Clay slopes in the Gwash valley” Phil Trans of the Royal Society A Series Vol 283 p463 -491
- A Hall 1980 “Late Pleistocene deposits at Wing Rutland”. Phil Trans of the Royal Society B Series Vol 289 Pages 135-164
- Higginbottom I.E and P.G. Fookes 1970 Engineering aspects of periglacial features in Britain QJof EG Vol 3,p85-117
- M.Leighton 1958 “Stagnancy of the Illinoian glacial lobe east of the Illinois and Mississipi rivers” J.Geol 67 pp 337-344
- T Wakeling and R Jennings 1976 Some unusual structures in the river gravels of the Thames basin. The QJof EG Vol9 no3 p255-263
- Howat, I.M., J.E. Box, Y. Ahn, A. Herrington and E.M. McFadden, 2010 Seasonal variability in the dynamics of marine-terminating outlet glaciers in Greenland, Journal of Glaciology, 56, 198, 601-613.
- West G. and M.J. Dumbleton 1972 Some observations on swallow holes and mines in the Chalk QJEngGeology Vol 5 p171-177
- A W Woodland 1970 “The buried tunnel valleys of East Anglia Proceedings of Yorkshire Geol Soc p521-78
- Images from the BBC are copyright and licensed to Geoscientist for publication.