Three-D seismic of course improves on simple bathymetry by probing inside ancient landscapes – both on and offshore; for example, imaging the internal structure of slumps and old cave systems, or linking submarine morphology to underlying tectonic structures. Seismic geomorphology is used by oil companies to provide analogues for deeper, less-well-imaged reservoirs – the better to plan hydrocarbon recovery, give notice of potential drilling hazards and, in future, maximising underground carbon-storage security. It also reveals the history of submarine slope failure, the better to evaluate tsunami risk.
But these images also open up new opportunities for fundamental stratigraphic research – charting how the near-surface of the earth has evolved through geological time. To date, most investigations have concentrated on using the relatively shallow parts of seismic data-sets, chiefly collected at sea, where signal quality is high. But increasingly, the combination of better acquisition and initial processing of seismic is allowing interpreters to use land-based data and deeper parts of the section. The effect is greatly to increase the reach of seismic geomorphological studies both in space, and back into deep time.
Much of the new imagery used in seismic geomorphology relies on imaginative use of seismic attribute mapping, ways of extracting information beyond the standard amplitude displays. Commonly, the first step in interpretation is carefully to pick out an individual seismic horizon – defining a single time-equivalent level that can be investigated. Sometimes, abrupt but short-range gradient changes on this horizon (the dip-attribute) alone can bring out features such as channel margins. But further information can be added by quantifying seismic amplitude variations along individual horizons. These variations are calculated automatically and draped over the mapped horizon. Amplitude attributes can predict sandy channel-filling sediment that might represent a potential hydrocarbon reservoir, and underpins many commercially available facies-mapping tools.
Much greater resolution is now available to interpreters through spectral decomposition, which uses the range of frequency content in seismic data. Careful frequency tuning can pick out further small discontinuities and heterogeneities within units – and their forms interpreted in terms of landscape features. The methods have moved far in the past decade, but new tools and approaches are being developed all the time – this is still a rapidly-developing area of Earth science.
In the vanguard of the science of seismic geomorphology stands Henry Posamentier, the Society’s 2010 William Smith medallist. Coinciding with the presentation of his medal, the Petroleum Group, in partnership with the Virtual Seismic Atlas, ran a meeting to showcase the exciting new imagery and the geology it inspires.
Frontiers of Seismic Geomorphology was held at Burlington House on June 1. Henry gave the keynote talk – with a supporting cast drawn from industry and academia. Collectively, they gave a master class in modern seismic interpretation for environments spanning the deep ocean to near-shore - and even to the foothills of the Canadian cordillera. Topics included mapping out submarine and fluvial channels and submarine landslides, through to linking faults in the subsurface to structures visible on seabed. Studies of ice-sheet dynamics are informed by tracking out the extent of ancient, originally sub-glacial, channel systems. New image-enhancement techniques can now detect ancient cave-systems in the subsurface, and the history and extent of flow packages that constitute thick sequences of flood basalt. Many of these new applications have yet to appear in print – they are true frontiers in seismic technology and geological interpretation.
Of course, original data required for seismic geomorphology come from the hydrocarbon sector - the only community to collect significant volumes of 3D seismic. This means that while industry now routinely uses these images, the new science has had rather restricted reach beyond the specialist literature and industry-facing conferences. You would be hard-pushed to find seismic geomorphology images in stratigraphy textbooks or undergraduate geology programmes.
Consequently, a chief aim of the meeting was to create a collection of dramatic images accessible to the widest audience. Preliminary output from the meeting is now live on the Virtual Seismic Atlas website, www.seismicatlas.org (to short-cut, type “Frontiers” in the VSA search box). This resource is freely accessible for teaching and training. Leading the way is a collection from Henry Posamentier that includes patch reefs and tidal channels, mass transport complexes and submarine channel-levee systems.
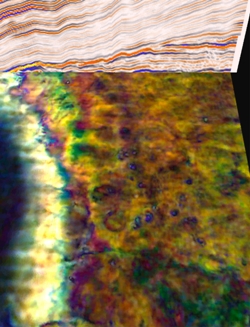
Submarine channels also feature in a stunning series provided by Shell’s Zoltan Sylvester from the eastern Gulf of Mexico. Dave Hunt of Statoil illustrates how spectral decomposition can resolve the extent of some Palaeozoic cave systems in part of the Barents Sea. Nearer home, Jenny Collier of Imperial College integrates seabed near-shore bathymetry with 2D seismic data to resolve the continuity of basin inversion structures off the Dorset coast. In coming months this collection will be expanded to include further geological settings and additional interpretative approaches.
Background reading and case studies are available in several GSL publications available through the Lyell Collection (e.g. Memoir 29, Special Publication 277).