In reviewing the distribution and formation of seamounts, Tony Watts highlights the societal implications of these abundant oceanic features and the urgent need for more seafloor mapping
Watts, A., Science, seamounts and society.
Geoscientist 29 (7), 10-16, 2019
https://doi.org/10.1144/geosci2019-039;
Download the pdf here
It has been more than one hundred years since the publication of Sir John Murray’s ‘bathymetrical chart’ of the Atlantic Ocean. Compiled from lead-line surveys during expeditions such as Challenger and Michael Sars, the coloured contour map revealed for the first time the nature of Earth’s surface beneath the oceans and the outline of the continental margins, the Mid-Atlantic Ridge and the intervening abyssal plains (Fig. 1). The profiles showed, however, that apart from the prominence of a few widely scattered islands such as the Azores, the seafloor of the oceans was smooth and featureless—a view that persisted for about the next four decades.
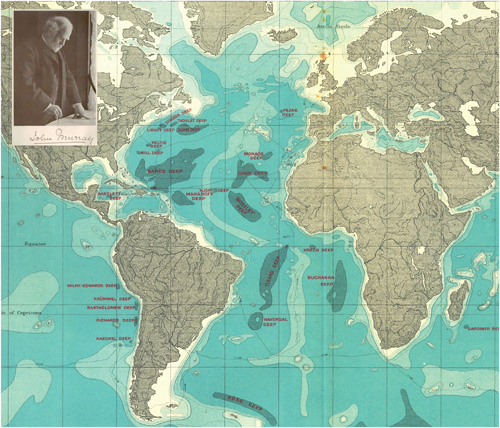 Figure 1. Sir John Murray and his ‘bathymetrical chart’ of the Atlantic, western Indian and eastern Pacific oceans published in 1912. Constructed from ~3,200 soundings made with pre-stressed hemp rope and lead weights on British and other survey ships. Abyssal plains (‘deeps’) correspond to depths >3,000 fathoms (5,486 m). Chart produced by John G. Bartholomew, cartographer to the King.
The development of new technologies during World War II dramatically altered this view. Arguably the most important was the Precision Depth Recorder (PDR), which used a hull-mounted acoustic transducer/receiver to continuously measure two-way reflection time and hence depth. The Princeton academic, Harry Hess, who had been given command of the troop-carrying ship USS Cape Johnston, for example, used a PDR to chart 160 flat-topped bathymetric features in the Pacific Ocean, rising up to 4.5 km above the seafloor. He named them guyots, in honour of the Swiss born geographer and Princeton Professor, Arnold H. Guyot. Hess (
Amer. J. Science 1946), and considered them as volcanic oceanic islands that had been wave trimmed prior to subsidence below sea level.
After more than three centuries of discovery on sailing ships, we know there are 1,770 ocean islands (all but one was discovered by 1840). 47 are active volcanoes and approximately 439 are atolls (Goldberg,
Atoll Research Bulletin 2016), which Charles Darwin hypothesized in 1842 comprise coral reefs that had grown upwards on the summit of volcanoes as they subsided below sea level.
While we now attribute the subsidence of guyots and atolls to sinking of the oceanic plate as it ages and cools, their spatial distribution raises questions about the origin of volcanic activity on Earth. The Smithsonian Global Volcano Program (SGVP), for example, lists 1,535 volcanoes that have been active since the Holocene, the large majority of which are associated with compressional plate boundaries, where one plate is underthrust by another (e.g. the circum-Pacific) and extensional plate boundaries, where the plates are moving apart (e.g. East Africa). Yet, the large majority of guyots and atolls are located in the interior of plates, far from plate boundaries (Fig. 2).
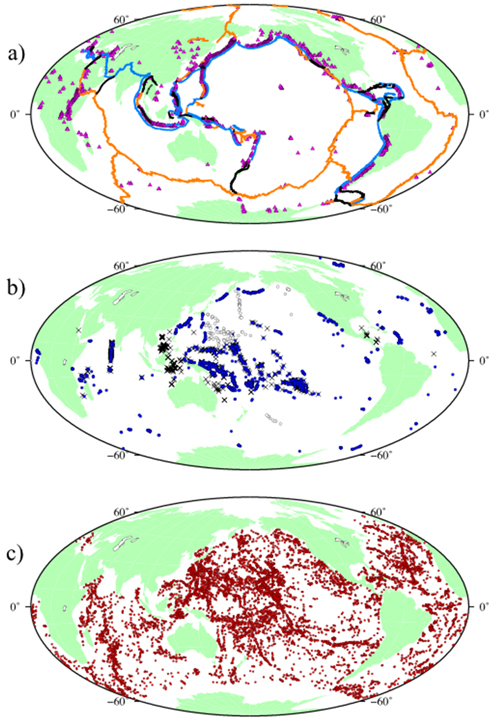 Figure 2. Global distribution of volcanoes, ocean islands and seamounts. a) Holocene to Recent volcanoes (filled red triangles), according to the Smithsonian Global Volcanism Program (https://volcano.si.edu/), compared to boundaries of major plates (blue, subduction zones; orange, mid-ocean ridges; black, transform/strike-slip faults). b) Ocean islands (filled blue circles), atolls (×). Guyots (unfilled circles) were once islands. Note: distribution of guyots is incomplete and probably more extensive than shown. c) Seamounts (filled red circles) with height above seafloor that is the same or greater than the height of Ben Nevis above sea-level, the highest mountain peak in the UK (1,344 m). (Data sources: Nunn, Ocean Islands 1994; Goldberg, Atoll Res. Bull. 2016; Smoot & King, Geomorph. 1997; Caplan-Auerback et al. J. Geophys. Res. 2000)
Here I show that when ‘seamounts’ are added into the mix, most of which are also volcanic in origin (Fig. 3), the spatial extent of magmatic activity on Earth changes even more dramatically. Indeed, the distribution raises important scientific questions about Earth’s ‘magmatic pulse’ and the origin of intra-plate volcanism, as well as societal questions about the role that seafloor volcanoes play in navigation, fisheries and geohazards.
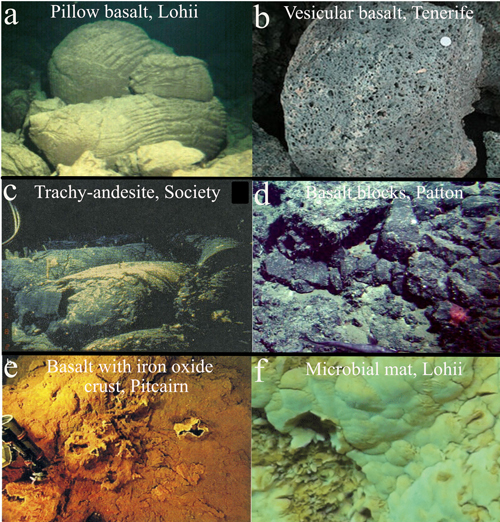 Figure 3. The flanks of intra-plate oceanic islands and seamounts in the Atlantic and Pacific oceans. They comprise mainly basaltic rocks that are geochemically distinct from basalts sampled at extensional (e.g. mid-ocean ridges) and compressional plate boundaries (e.g. island arcs). Bottom row, examples of the reaction of seawater with iron and magnesium in the basalts, the products of which are an important source of microbial life. (Image credits: a, Photo by A. Malahoff, University of Hawaii, 1980; b, Author’s own; c, Binard et al., In Ocean Hotspots. Hekinian et al. (eds) 2004 © Springer; d, Public domain; e, Scholten et al., In Ocean Hotspots. Hekinian et al. (eds) 2004 © Springer; f, Chan et al., Front. Microbio. 2016 CC-BY 4.0
 Note: figures c and e are exempt from the Creative Commons licence, and are reprinted by permission from Springer Nature Customer Service Centre (SNCSC)).
What is a seamount?
In his 1964 book, Marine Geology of the Pacific, Bill Menard defined a seamount as:
“a more or less isolated elevation of the sea floor with a circular or elliptical plan, at least 1 km of relief, comparatively steep slopes and relatively small summit area”
Menard estimated there were about 2,000 seamounts greater than 1 km high in the ocean basins. Satellite-derived gravity and ship PDR data, however, show there are >14,500 seamounts higher than 1 km. A large concentration is found in the western Pacific Ocean (Figs 2, 4). Some of these seamounts are growing up on the seafloor and may become islands, while others were once islands that are now sinking.
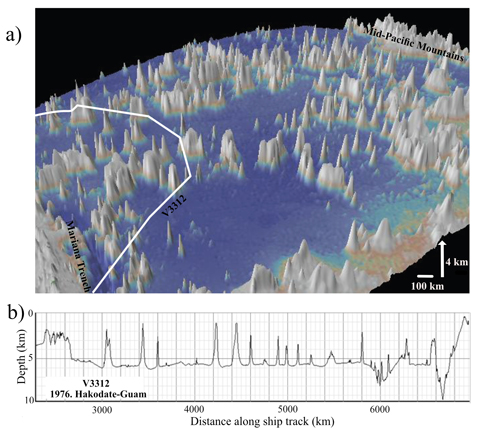 Figure 4. Western Pacific Ocean seafloor bathymetry, between the Mariana Trench and the Mid-Pacific Mountains. a) Perspective view to NE (gridded data set from Ryan et al., G3 2009; GeoMapApp, http://www.geomapapp.org/; Marine Geoscience Data System, www.marine-geo.org). Vertical exaggeration ×25. Scale approximate. White line illustrates the ship track of R/V Vema cruise V3312. b) PDR bathymetry profile along the Vema ship track.
An important technological development in the late 1980s was the introduction of multibeam swath bathymetry systems. These had an advantage over PDRs in that rather than determining water depth immediately beneath a ship’s hull, they insonified a broad swath of the seafloor, up to 2.5 times the water depth. Such systems revealed the morphology of seamounts, guyots, atolls and ocean islands in unprecedented detail, for example those along the Hawaiian-Emperor seamount chain in the central Pacific Ocean (Fig. 5). Other islands to have had their submarine slopes swath mapped include the Canary and Cape Verde in the Atlantic Ocean, and La Reunion and Kerguelan in the Indian Ocean. However, the number of swath surveys carried out to date is limited and only about 10-12% of the seafloor has been insonified.
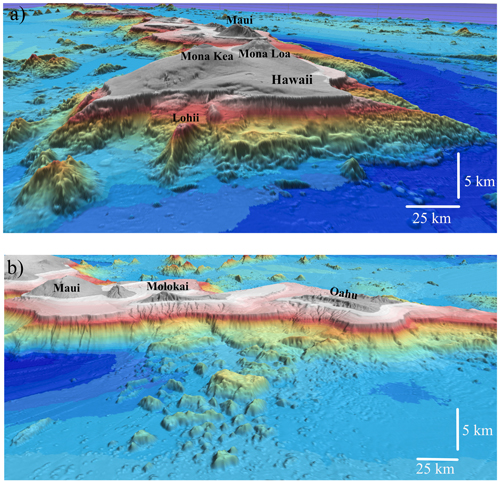 Figure 5. Submarine flanks of the Hawaiian Islands (perspective views). a) SE flank of Hawaii showing Loihi, the newest submarine volcano of the island chain. b) N flank of Maui, Molokai and Oahu showing incised canyons, large-scale slope failures and debris flow deposits with large blocks that over fill the bathymetric moat that flanks the islands. Vertical exaggeration ×4. Scales approximate. (Data set from Ryan et al., G3, 2009; GeoMapApp, http://www.geomapapp.org/; Marine Geoscience Data System, www.marine-geo.org).
Seamount dynamics
While we still do not know how many seamounts are growing and sinking, field observations suggest they are important to fully understanding Earth history and environmental change. Field sample and scientific drill data suggest that there have been bursts of volcanism in the oceans, for example the 90 to 100 -million-year ‘event’ that created many of the seamounts and oceanic plateaus in the central Pacific Ocean (e.g. Shatsky Rise, Hess Rise, Mid-Pacific Mountains). There may have been other such volcanic events in the Pacific Ocean, peaking in the Eocene and Late Jurassic. Once formed seamounts are susceptible to modification by large-scale sector collapse, as manifest by scalloped coastlines, submarine debris flows and the emplacement of large blocks on the seafloor. Such processes operate on time scales on the order of hundreds of thousands of years as seen, for example, in the Icod and La Orotava landslides on the north flank of Tenerife in the Canary Islands.
In historical times, seamounts show surprising variability on scales that greatly exceed their terrestrial counterparts. The number of historically active volcanoes in the SGVP data set is 538, about 35% of the total number of volcanoes younger than Holocene. If a similar percentage of seamounts higher than 1 km are active, then we might expect upwards of about 5,000 historically active volcanoes on the ocean floor. We know, however, only a few (~12) from floating pumice and discoloured water, Remotely Operated Vehicle (ROV) observations, and repeat swath bathymetry surveys.
One of the best-surveyed active submarine volcanoes is Monowai in the Tonga-Kermadec arc, Southwest Pacific Ocean. The volcano (Fig. 6) was swath surveyed in 1998, 2004, 2007, 2011 and 2013. Large differences, up to several tens of metres, were measured between the surveys. During the 32-day-long cruise of M/V SONNE in 2011, the volcano was surveyed twice. Seismic data recorded on Rarotonga (Cook Islands) revealed that the volcano erupted during May 17-22, 2011 and surveys with swath bathymetry before and after the eruption showed dramatic differences: the seafloor depth on the cone summit shallowed by up to 70 m and deepened by up to 18 m.
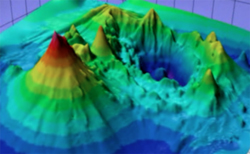 Figure 6. Monowai in the Tonga-Kermadec island arc (perspective view, towards NW), southwest Pacific Ocean. The volcano comprises a ~1,000-m-high, 10-12-km-wide stratovolcanic cone with parasitic cones and a flanking ~500-m-deep, 7-10-km-wide caldera with ring faults and a central mound. Normal fault network in the far distance forms part of an echelon half-graben structure. (Data from the SONNE Cruise 215, https://www.bodc.ac.uk/.)
The seismic events recorded on Rarotonga were generated by the rapid emplacement of volcanic rock onto the seafloor. They originated as hydroacoustic waves that had become trapped in the SOund Fixing And Ranging (SOFAR) channel, the low velocity sound layer in the ocean that transmits whale calls. When these waves, known as T-waves, impact an ocean island they convert to body waves and, depending on noise levels, may be recorded on a seismic station on an ocean island.
Another recorder of T-waves are the hydrophone stations maintained by the Consortium for Test-Ban Treaty Organization (CTBTO). Three hydrophones are deployed on tethers in the SOFAR channel so a T-wave generated by an active submarine volcano will, if it is not obstructed, have a unique back azimuth when it arrives at a station. Explosive activity at Monowai, for example, has a back azimuth of 243.8
o at a station located south of Juan Fernandez Island in the eastern Pacific Ocean (Fig. 7). A recent study of these data by Dirk Metz (Oxford University) reveals that Monowai has erupted some 82 times over a 3.5-year period, making it arguably the most active volcano on Earth.
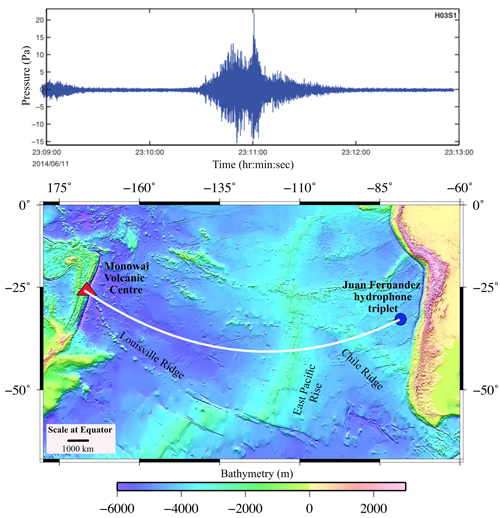 Figure 7. Typical T-wave generated by volcanic activity at Monowai in the Tonga-Kermadec arc and recorded at the hydrophone stations maintained by the CTBTO south of Juan Fernandez Island, eastern Pacific Ocean. T-waves recorded at Juan Fernandez have a back azimuth unique to Monowai (243.8o) and provide a means to continually monitor the submarine volcanic centre. Note: T-waves are able to transmit across the south Pacific Ocean despite possible bathymetric obstructions on the Louisville Ridge, East Pacific Rise and Chile Ridge (data replotted from Metz et al., J. Geophys. Res. 2018).
Origin of seamounts
Away from island arcs, many seamounts form distinct lines that progressively increase in age away from an active volcano and can be explained by absolute motion of a tectonic plate over a fixed mantle hotspot. The 7,000-km-long Hawaiian-Emperor seamount chain in the central Pacific Ocean is arguably the best-known example of such a hotspot track. Seamounts increase in age from ~20 ka at the young end of the chain, through ~50 Ma at the Hawaiian-Emperor ‘bend’, to ~80 Ma at the old end of the chain. The young end comprises ocean islands that are superimposed on a broad topographic swell ~1.5 km in height, which gravity and seismic data suggest is supported by a deep mantle plume, while the old end is characterized by guyots and an absence of a swell.
A fixed hotspot origin for the seamount chain is supported by palaeomagnetic data that show the Hawaiian ridge, up to the ‘bend’, formed at or near the present-day latitude of the Hawaiian hotspot. But, palaeomagnetic data show that the Emperor Seamounts, beyond the ‘bend’, formed at a latitude up to 15
o north of the current location of the hotspot. John Tarduno (University of Rochester) and colleagues have interpreted this as evidence that during 50 to 80 Ma, the Hawaiian hotspot was not fixed with respect to the deep mantle and had migrated south while the plate moved north.
While palaeomagnetic data suggest the Louisville Ridge, a seamount chain with a ~50 Ma ‘bend’ in the southwest Pacific Ocean, may also have formed at a fixed mantle hotspot, other volcanic lines are more difficult to explain. Some show an age progression, yet form close to a mid-ocean ridge (e.g. the Lamont Seamounts close to the East Pacific Rise) and have been attributed to a ‘mini hotspot’ at the ridge. Others (e.g. the Puka Puka Seamounts, south-central Pacific) show no evidence of an age progression and have been attributed to magmatically filled tension cracks generated by stresses set up in the Pacific Plate by processes such as a slab pull, convective instabilities and mantle dynamics.
Most difficult to explain are the numerous isolated seamounts that litter the seafloor. Some occur in regions of plate flexure at trench-outer rises (e.g. the ‘petit spot’ volcanoes in the western Pacific), submarine volcanic loads (e.g. the ‘North and South Arch’ volcanics of the Hawaiian Islands) and along transform faults and ‘leaky’ fracture zones, where plate-bending stresses may be high enough to cause faulting. Others are too widely scattered and show no obvious link to regions of loading and flexure. The occurrence of so many scattered seamounts (Fig. 2) implies an extensive melt source in or below the oceanic crust and lithosphere. The observation by Nicholas Schmerr (NASA Goddard) and colleagues of seismic precursors to underside reflections from the crust between an earthquake and a receiver that suggest an age-independent discontinuity (the Gutenberg discontinuity) at about 65±10 km depth is therefore an exciting development, especially as it might reflect an ocean-wide, thin zone of partial melt.
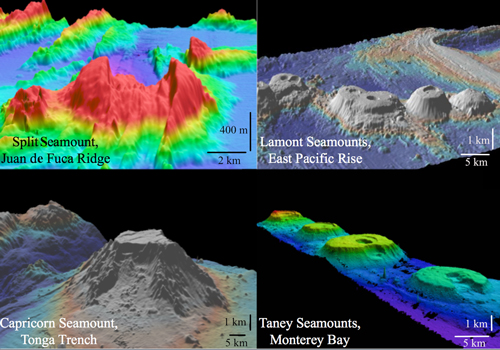 Figure 8. Isolated seamounts and short seamount chains in the Pacific Ocean (perspective views). Data sources: Lamont and Capricorn seamounts, gridded data set from Ryan et al., G3, 2009; GeoMapApp, http://www.geomapapp.org/; Marine Geoscience Data System, www.marine-geo.org; Split Seamount, GeoMapApp, with data from Carbotte et al., Geology 2006, image courtesy of Bill Ryan; Taney Seamounts from Coumans et al., J. of Petrology 2015). Vertical exaggeration ranges from ×2 (Taney) to ×5 (Split). Scales approximate. Capricorn’s flat top is tilted down towards the Tonga Trench. Large-scale sector collapses are visible on Capricorn and the Taney and Lamont seamounts. Summit craters are visible on the Lamont and Taney seamounts.
Seamounts and society
While the origin of seamounts, especially the isolated ones, remains a scientific enigma, they are significant in a number of ways that impact society. Seamounts have steep slopes (up to ~25
o) and rise abruptly above the regional seafloor depth, so are potential hazards for navigation. This was illustrated in a tragic accident in 2005. The USS San Francisco, a nuclear attack submarine, collided with an uncharted seamount at 160 m depth, between Pikelot and Lamotrek atolls in the western Pacific Ocean (Fig. 9). Four minutes prior to the collision the seafloor, depth was measured at 2,000 m.
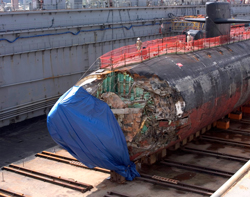 Figure 9. USS San Francisco in Guam (January 2005). The submarine was in collision with an uncharted seamount while travelling at 33 knots between Guam and Brisbane. One sailor was killed and 115 others were injured. Image source: US Navy, https://en.wikipedia.org/wiki/USS_San_Francisco_(SSN-711).
Seamounts also act as seismicity moderators, tsunami wave scatterers, oceanographic “dip sticks” and biodiversity “hotspots”. Seamounts carried by plate motions towards a trench, for example, are potential asperities on a subduction zone megathrust and may either inhibit or promote seismic activity. Furthermore, if intact when subducted into a trench, seamounts may disrupt the forearc (the region between the trench and arc) and cause submarine landslides. And seamounts may diffract earthquake-generated tsunami waves, which may, in turn, focus the waves more along one segment of coastline than another. Finally, seamounts may be sites of a tidal-induced ocean turbulence, which aids in bringing nutrients from the flank of a seamount to its summit. Indeed, some of our favourite fish and their predators are found on the summits of seamounts and seamounts have been targeted by the fishing industry, although not always with a positive outcome for their coral habitats, as for example in the Graveyard Seamounts, east of New Zealand (Fig. 10).
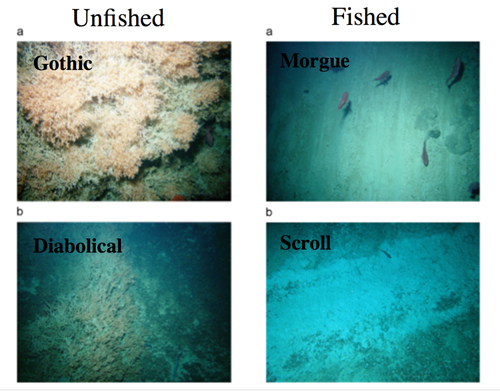 Figure 10. Unfished and fished seamounts in the Graveyard Seamounts, east of New Zealand. Unfished seamounts have extensive areas of cold-water corals that support a diverse array of invertebrates. Fished seamounts have had their coral removed by a fishing bottom trawlers that leave their marks in the pelagic drape on the seamount summits. (Images reproduced from Clark & Rowden, Deep-Sea Res.2009 © Elsevier).
Limits of exploration
The lack of field data limits our exploration of seamounts. The number of scientific research cruises with PDRs onboard increased rapidly following World War II, but has been in a steady decline since the early 1970s. Single-beam bathymetry ship-track coverage is therefore limited, especially in the south Pacific Ocean, south of latitude 26
o S (Fig. 11). Multibeam swath bathymetry coverage is even sparser. Imagine the difficulty in determining the geology of a country the size of France from just a few transects of geophysical data!
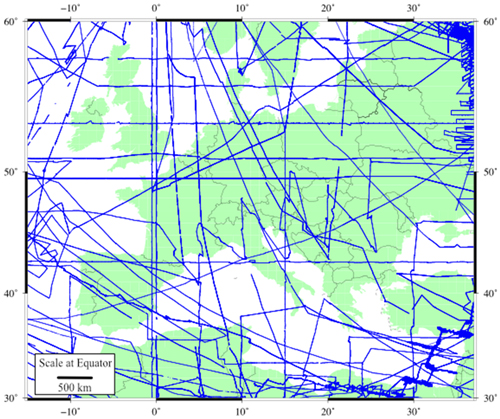 Figure 11. All available single-beam bathymetry, gravity and magnetic ship-track data in part of the central Pacific Ocean (-165 o to -113 o longitude and -56 o to -26 o latitude) superimposed at the same scale on a map of Europe (blue lines, ship tracks; grey lines, national boundaries). Despite their large surface area, seafloor the size of the UK, Germany and France has been sampled by the equivalent of just 8, 8 and 5 ship tracks, respectively. Seafloor equivalent to entire countries (e.g. Greece, Bulgaria and Poland) has barely been sampled at all. Data from http://www.geomapapp.org/
The challenge becomes even clearer when we consider the number of seamounts that might exist in the world’s oceans. Satellite-derived gravity data have found most, if not all large seamounts, but few of the small ones, while ship PDRs have found some large seamounts (ships tend to avoid the largest seamounts!) and many of the small ones (Fig. 12). If we assume that satellites have found all the seamounts with heights between say 2 and 9 km, then the relationship between the number and height of seamounts in this height range can be extrapolated into the domain of the smaller, yet still significant seamounts, taking into account the relationship found in the ship data. When we do this, we find that there may upwards of ~30,000 seamounts in the height range of 1 to 2 km that still remain to be discovered!
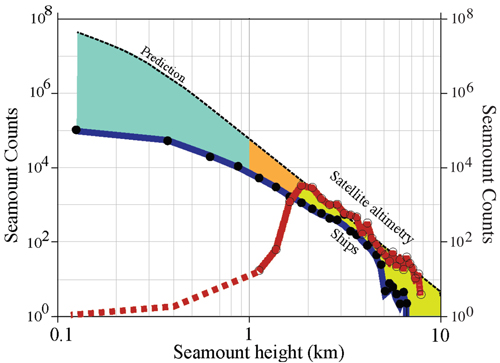 Figure 12. Number of seamounts vs. seamount height above the regional seafloor depth. Satellite data (thick red line) reveal nearly all the large seamounts, while surface ship data reveal most of the small seamounts (dark blue thick line). Orange and green shaded region suggests many more seamounts remain to be discovered, a few tens of thousands of which may have heights up to 1-2 km. (Data replotted from Hillier & Watts, Geophys. Res. Letts., 2007).
So, what might Sir John Murray and the other great bathymetric chart makers of the last century, such as Heezen and Tharp, Uchipi and Emery, and Fisher and Mammerickx, have made of this challenge? Surely, they would have wanted the ocean floor to be mapped in its entirety. Walter Smith and Karen Marks (Laboratory for Satellite Altimetry, National Oceanic and Atmospheric Administration; NOAA) estimate that it will take about 200 ship years (e.g. 20 ships for 10 years) to completely swath map the world’s ocean basins and their margins. Incidents such as the loss of flight MH370 and the 2004 and 2005 Java-Sumatra megathrust earthquakes suggest that we should start soon in order to build a global database that can be used as a reference to compare with new data, so enabling changes in seafloor depth to be detected. The challenge will require international collaboration and will take time and cost money (Mayer
et al. Geosciences 2018).
We could begin now, however, by encouraging academic research ships with onboard swath systems to record data not only in their survey regions, but during transits to and from a focus site. Such efforts could be enhanced by public engagement using ‘ships of opportunity’, for example cruise ships, Navy vessels and ‘megayachts’. Only then perhaps might we be able to put to rest the well-known cliché that we know the surfaces of the Moon, Mars and Venus better than we know the surface of our own planet.
Tony Watts is a Professor of Marine Geology and Geophysics at Oxford University; e-mail: [email protected]
References
Binard, N. et al. (2004) South Pacific Intraplate Volcanism: Structure, Morphology and Style of Eruption. In: Hekinian R., et al. (eds) Oceanic Hotspots. Springer, Berlin, Heidelberg;
https://doi.org/10.1007/978-3-642-18782-7_6
Caplan-Au
https://doi.org/10.1130/G21969.1erback, J. et al. (2000) Origin of intraplate volcanoes from guyot heights and oceanic paleodepth, J. Geophys. Res., 105, 2679-2697;
https://doi.org/10.1029/1999JB900386
Carbotte, S.M. et al. (2006) Rift topography linked to magmatism at the intermediate spreading Juan de Fuca Ridge, Geology, 34, 209-212;
https://doi.org/10.1130/G21969.1
Chan, C.S. et al. (2016) The Architecture of Iron Microbial Mats Reflects the Adaptation of Chemolithotrophic Iron Oxidation in Freshwater and Marine Environments, Frontiers in Microbiology, 7;
https://doi.org/10.3389/fmicb.2016.00796
Clark, M.R. & Rowden, A.A. (2009) Effect of deepwater trawling on the macro-invertebrate assemblages of seamounts on the Chatham Rise, New Zealand, Deep-Sea Research 56, 1540-1554;
https://doi.org/10.1016/j.dsr.2009.04.015
Coumans, J.P., et al. (2015) The Magmatic Architecture of Taney Seamount-A, NE Pacific Ocean, J. of Petrology, 56, 1037-1067;
https://doi.org/10.1093/petrology/egv027
Darwin, C. (1842) Structure and distribution of coral reefs, South Elder and Co., London, 207 pp.
GeoMapApp, Marine Geoscience Data System;
http://www.geomapapp.org/
Goldberg, W.M. (2016) Atolls of the world: revisiting the original checklist, Atoll Research Bulletin. Smithsonian Institution Scholarly Press, 610, 1-47; doi: 10.5479/si.0077-5630.610
Hekinian, R. et al. (2004) Oceanic Hotspots: Intraplate Submarine Magmatism and Tectonism. pp. 480, Springer, Berlin Heidelberg;
https://www.springer.com/gp/book/9783540408598
Hekinian, R. et al. (2003) The Pitcairn hotspot in the South Pacific: distribution and composition of submarine volcanic sequences. J. Volc.Geotherm. Res.121, 219-245;
https://doi.org/10.1016/S0377-0273(02)00427-4
Hess, H.H. (1946) Drowned ancient islands of the Pacific basin, Amer. J. Science, 244, 772-791; doi: 10.2475/ajs.244.11.772
Hillier, J.K. & Watts, A.B. (2007) Global distribution of seamounts from ship-track bathymetry data, Geophys. Res. Letts., 34, 1-5;
https://doi.org/10.1029/2007GL029874
Mayer, L. et al. (2018) The Nippon Foundation—GEBCO Seabed 2030 Project: The Quest to See the World’s Oceans Completely Mapped by 2030, Geosciences, 8, 63;
https://doi.org/10.3390/geosciences8020063
Menard, H.W. (1964) Marine Geology of the Pacific, McGraw-Hill, New York, 271 pp.
Menard, H.W. (1986) Islands, Scientific American Books Inc., W.H. Freeman & Co., New York, Oxford, 230 pp.
Metz, D. et al., (2018) Tracking submarine volcanic activity at Monowai: Constraints from long-range hydroacoustic measurements, J. Geophys. Res., 123, 7877-7895;
https://doi.org/10.1029/2018JB015888
Mitchell, N.C. et al. (2002) The morphology of the submarine flanks of volcanic oceanic islands: A comparative study of the Canary and Hawaiian hotspot islands, J. Volcanology and Geothermal Research, 115, 83-107;
https://doi.org/10.1016/S0377-0273(01)00310-9
Monterey Bay Aquarium Research Institute;
https://www.mbari.org/science/seafloor-processes/volcanoes/seamounts/
Murray, J. & Hjort, J. (1912) The Depths of the Ocean, MacMillan and Co., Limited, St. Martin's Street, London 821 pp.
Nunn, P.D., (1994) Oceanic Islands, First Edition, 413 pp. Pages, Blackwell, Oxford.
Oceanography (2010) Special Issue on “Mountains in the Sea”, 23, No. 1., The Oceanography Society, 231 pp;
https://www.jstor.org/stable/e24861047
Paulatto, M. et al. (2014) Potential field and high-resolution bathymetry investigation of the Monowai volcanic centre, Kermadec Arc: implications for caldera formation and volcanic evolution, Geophys. J. Int., 197, 1484-1499;
https://doi.org/10.1093/gji/ggt512
Ryan, W.B.F. et al. (2009) Global Multi-Resolution Topography synthesis, Geochem. Geophys. Geosyst., 10, Q03014,
https://doi.org/10.1029/2008GC002332
Schmerr, N. (2012) The Gutenberg Discontinuity: Melt at the Lithosphere-Asthenosphere Boundary, Science, 335, 1480-1483; DOI: 10.1126/science.1215433
Scholten, J.C. et al. (2004) Hydrothermal Iron and Manganese Crusts from the Pitcairn Hotspot Region. In: Hekinian R., et al. (eds) Oceanic Hotspots. Springer, Berlin, Heidelberg;
https://doi.org/10.1007/978-3-642-18782-7_13
Smith, W.H.F. & Marks, K.M. (2014) Seafloor in the Malaysia Airlines Flight MH370 search area, EOS, 95, 173-180.
Smoot, N.C. & King, R.E. (1997) The Darwin Rise demise: the western Pacific guyot heights trace the trans-Pacific Mendocino fracture zone, Geomorphology, 18, 223-235;
https://doi.org/10.1016/S0169-555X(96)00032-3
Tarduno, J.A. et al. (Z003) The Emperor Seamounts: Southward Motion of the Hawaiian Hotspot Plume in Earth's Mantle, Science, 301, 1064-1069, doi: 10.1126/science.1086442
Watts, A. B., et al. (2012) Rapid rates of growth and collapse of Monowai submarine volcano, Kermadec Arc, Nature Geoscience 5, 510-515;
https://doi.org/10.1038/ngeo1473
Wessel, P. (2001) Global distribution of seamounts inferred from gridded Geosat/ERS-1 altimetry, J. Geophys. Res., 106, 19431-19441;
https://doi.org/10.1029/2000JB000083
Pillow Basalt at Loiho;
https://hilo.hawaii.edu/~kenhon/GEOL205/loihi/default.htm
SONNE Cruise 215 data archived in the British Oceanographic Data Centre;
https://www.bodc.ac.uk/
Volcanic History of Seamounts in the Gulf of Alaska;
https://oceanexplorer.noaa.gov/explorations/02alaska/background/geology/geology.html