 Earthquake Storms
Ever since the devastating 1906 earthquake in San Francisco, the San Andreas fault—first recognised by Andrew Lawson in 1895—has been the world’s most famous geological fault. Yet despite its celebrity, there are hardly any good recent books about the fault for the non-specialist: perhaps only historian Philip Fradkin’s Magnitude 8: Earthquakes and Life along the San Andreas Fault, which gives more space to the fault’s impact on Californian politics, economics and culture than to seismology.
Earthquake Storms, by California-trained geologist John Dvorak, is therefore a welcome addition. Its chief strength lies in combining the lives and personalities of key geologists and seismologists, such as Lawson, Charles Richter, John Tuzo Wilson and Kerry Sieh, with the theoretical essentials and practical details of their scientific work, so that the former really do illuminate the latter—notwithstanding the regrettable absence of a map of California or any seismological diagram. For example, we learn the inside story of the classic Edwardian photograph (reproduced in the book) of a woman, dressed in a dark ankle-length skirt and hat decorated with flowers, standing somewhat incongruously beside the ‘mole track’ ridge thrown up by the San Andreas fault as it ruptured 270 miles of northern California. The photo was taken by geologist Grove Karl Gilbert, a member of the 1906 earthquake commission; the woman is his lover Alice Eastwood, a leading botanist with a daredevil streak. Just weeks before, while her San Francisco apartment burned in the great fire started by the earthquake, Eastwood had twice scaled the iron banisters of the wrecked central staircase of the California Academy of Sciences so as to rescue her rare botanical collection from the sixth floor.
The book’s title is taken from geophysicist Amos Nur, who suggested in 2000 that one earthquake may trigger another, causing them to cluster together in ‘earthquake storms’. Several major earthquakes over a period of mere decades around 1200BC were responsible for the destruction of western civilisation (Knossos, Mycenae, Troy, etc) in the eastern Mediterranean, argues Nur. The same pattern has been occurring in southwest China along the northern edge of the Tibetan plateau since the 1890s, says Dvorak. Might a seismic storm also occur in southern California in coming decades, following two puzzling Mojave Desert earthquakes in the 1990s? Conceivably. But given the mind-boggling complexity of California’s faults—700 of which have ruptured over 10,000 years—earthquake prediction is currently impossible, as Dvorak finally has to concede.
Reviewed by Andrew Robinson
EARTHQUAKE STORMS: THE FASCINATING HISTORY AND VOLATILE FUTURE OF THE SAN ANDREAS FAULT by JOHN DVORAK, 2014. Published by: Pegasus Books 254pp (hbk) ISBN: 9781605984957 List Price: $27.95. W: www.pegasusbooks.us
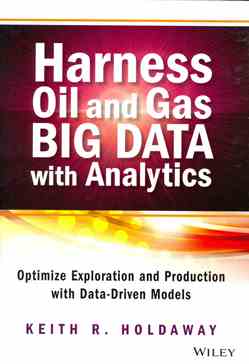
 Harness Oil and Gas Big Data with Analytics
The title of this book intrigues. The text explains that big data are data sets that are so large and complex that they are difficult to process using current conventional processing methods, and analytics is the process of finding meaningful patterns within these sets.
Data sets are growing in size, in part because of the ability of modern information-sensing devices to collect vast quantities of data, as with seismic acquisition. The sizes are mind-boggling, with single data sets going up to (maybe soon) exabytes (1018). ‘Analytics’ uses massive parallel-computer software to uncover hidden patterns. The output of 'hidden' knowledge is often visualised in tables and graphics.
The practical aspect of analytics is needed for the oil and gas industry because the new generation of managers and geoscientists who are replacing the retiring 'old school' lack their experience of vision, but have an appreciation of statistics and soft computing methodologies. Analytics can show otherwise hidden patterns and may be able to retain the lost experience and enhance decisions.
The book therefore provides a complete view of big data and analytics techniques as applied to the oil and gas industry. After two chapters outlining the processes, the book moves to chapters of specific case-studies where data analytics have been used within exploration and production. Applications, using case histories of seismic attribute analysis, give guidance on reservoir characterisation, while other chapters explore drilling and completion optimisation, reservoir management production forecasting and optimisation, and exploratory predictive analysis. Analytics suggest better-informed models of subsurface reservoir characterisation and decisions for drilling/production optimisation for conventional and unconventional fields.
This book, which is written by an industry practitioner, is a description of the subject rather like the technical information found in ‘service company’ literature. The text mentions, but does not detail, the mathematics or algorithms of the methods commonly applied - such as neural networks, decision trees, genetic algorithms, data mining and artificial intelligence. Unfortunately, many of the figures are disappointing and unhelpful, with many taken from papers which were originally in colour but printed in greyscale. Some are almost unreadable. I suspect too the vocabulary might be difficult for some. A fuller glossary giving more definitions of the acronyms and terms scattered within the text would be helpful for the 'old school’.
Harness Oil and Gas Big Data with Analytics is not going to turn the reader into a digital oilfield expert, but should give an idea of where/how analytics might be beneficial.
Reviewed by Richard Dawe
HARNESS OIL AND GAS BIG DATA WITH ANALYTICS by KEITH R HOLDAWAY. Published by John Wiley & sons, 2014. ISBN 978-1-118-77931-6 hbk; ISBN 978-1-118-91095-5 epdf ; ISBN 978-1-118-91094-5 epub. List price (hbk): £50.00 W: www.wiley.com
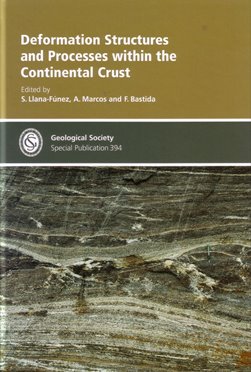
 Deformation Structures and Processes within the Continental Crust
This Special Publication, a worthy contribution to its field, consists of 12 papers, presented in three themes, developed from a ‘Deformation Mechanisms, Rheology and Tectonics Meeting’ held at the University of Oviedo in late 2011.
The first four papers are presented under the theme of ‘Structures: shear zones and folds’ and provide novel and interesting approaches to quantifying, analysing, and differentiating strain within single and multiple generations of ductile structures. Lisle (2013) reviews new and existing methods for analysing finite strain in shear zones and presents a new algebraic and, graphical method to quantifying finite strain where volume change during deformation is considered.
Frehner & Exner (2013) apply a numerical approach when considering the refraction patterns in axial foliation (fans) to understanding the distribution of strain within buckle folds and make important observations regarding the rheological sensitivity of layers to recording strain. Calvín-Ballester & Casa (2013) employ geometrical approaches to differentiate the development of two superimposed thrust-fault - cleavage-forming events formed during progressive orogenic deformation in a foreland fold-and-thrust belt. Weisheit et al. (2013) utilise a range of thermochronological data coupled with structural analysis and reconstruction to demonstrate the development of a crustal-scale fold occurred over two deformation cycles spanning ~200Ma.
The next five papers, presented under the theme of ‘Magmatism and Structure’, provide examples of how the development of structural features is frequently linked to magmatic activity and hence often amenable to geochronological dating. Rutter et al. (2013) use 40Ar/39Ar dating techniques on pre- and syn-tectonic volcanism to constrain the duration of the main movement along a crustal-scale transform fault system. Similarly, Rodríguez-Méndez et al. (2013) date diabase dykes linked to basin-wide magmatism to better constrain the changing geodynamic regime heralding the break-up of Pangaea. Magma often utilises crustal-scale structures as conduits for ascent and emplacement and Oriolo et al. (2013) using detailed structural, kinematic, and geophysical data, show the importance of pre-existing cross-strike structures associated with flat-slab segments as reactivated conduits for magmatism; a significant observation for economic geologists.
Caggianelli et al. (2013) model the thermal effect of a magmatic intrusion on the rheology of the host rocks suggesting that while multiple intrusions within the crust would be required to sustain mechanical weakening, a single intrusion maybe sufficient to nucleate a normal fault that could allow further thermal weakening through crustal extension. Morgan et al. (2013) highlight deficiencies in the ‘Titanium-in-Quartz’ geothermometry associated with Ti heterogeneity and its chemical activity during metamorphic conditions.
The final three papers are presented under the theme ‘Microstructures and Rheology’ and illustrate the effect of crystallographic preferred orientation (CPO) of mineral grains and recrystallisation on mechanical behaviour of rocks at the micro-scale. Liana-Fúnez & Rutter (2014) experimentally explore the relation between CPO of calcite in limestone during ductile deformation and localisation of strain geometries. Similarly, Piazolo & Jaconelli (2013) consider the rheology of sillimanite aggregates in gneiss defined by slip-systems at high-temperatures related to the aggregates CPO. A numerical approach by Borthwick et al. (2013) explores the effects of recovery recrystallisation in rocks close to their deformation temperatures showing that microstructures can be modified at temperatures lower than experienced during peak deformation.
Reviewed by Mark N Burdett
DEFORMATION STRUCTURES AND PROCESSES WITHIN THE CONTINENTAL CRUST by S LLANA-FÚNEZ, A MARCOS, & F BASTIDA (Eds) 2014 Geological Society of London Special Publication 394 ISBN 978-1-86239-627-2 239pp (hbk)List Price: £90 (Fellows £45; Other societies £54) Go to bookshop
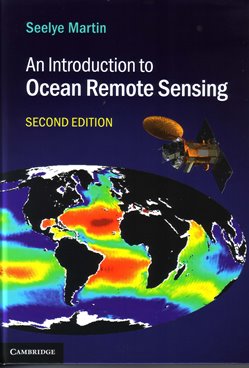
 Introduction to Ocean Remote Sensing
This book explains how remote sensing works; particularly remote sensing of biogeochemical properties, infrared and microwave retrieval of sea surface temperature and salinity etc., passive microwave measurements, scatterometer wind retrieval, altimetry and SAR. The book tells you how to understand observations from Earth-observing systems, and the observations’ importance to physical and biological oceanography. The author presents all the necessary mathematics to support and understand the text.
The book contains a useful list of abbreviations, acronyms, mathematical symbols, references and an appendix giving technical details. Also included are descriptions of the online archives where data can be obtained (e.g. NASA and ICES) and online tools for working with the data. It is suitable for graduate and advanced undergraduate students in oceanography, remote sensing and environmental science, and a practical resource for researchers and professionals.
The author begins by talking of the oceans and how important they are, covering about 70% of the Earth’s surface and containing most of the Earth’s water. They are dynamic at several scales and contain important and productive ecosystems. They play a big role in climate change and are important for heat storage and transfer.
The book considers the emitted and reflected radiation from the open ocean and how the ocean properties modify them at the surface. Satellite images (e.g. radar) can be used to detect such things as oil slicks. The book relates how the atmosphere and its constituents (e.g. oxygen, nitrogen and especially water vapour) affect the transmission of radiation in the visible infrared and microwave regions of Earth observation.
Passive multi-frequency microwave imagers are very useful for sea surface temperatures and salinity, sea ice extent, scalar and vector wind speeds. Ocean winds are important for the way they drive ocean currents, transfer heat, gases, heat and moisture, energy and momentum. They can be examined in detail using a scatterometer, which are of great importance in weather forecasting.
The Radar Altimeter can provide much information about global variation in sea surface height, swell and wind speeds (all very useful measurements in oceanography). Side-looking radars are also discussed (powerful tools to examine ice and ocean surface backscatter properties at a high resolution).
This is a comprehensive text, well-written, printed and bound, containing many diagrams and colour photographs and well worth its rather modest cover price.
Reviewed by Steve Rowlatt
AN INTRODUCTION TO OCEAN REMOTE SENSING by Seelye Martin. Published by: Cambridge University Press Publication date 2014 Hbk ISBN 978-1-107-01938-6 Edition: 2. 521pp List Price £45. W: www.cambridge.org