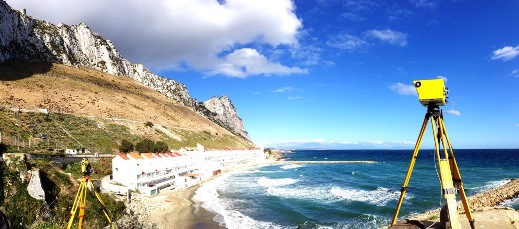
Above: Limestone coastal cliffs undergoing LiDAR survey
Adrian Wilkinson* discusses point-cloud surveys captured by LiDAR and drones and how data capture is being adopted by the geoscientific professions.
 In an industry that requires regular topographical surveys for mineral royalty payments, geological face mapping for aggregate quality management and geotechnical measurements for quarry-face stability assessments, surveyors and geologists working in the quarrying industry frequently find themselves working in potentially hazardous environments.
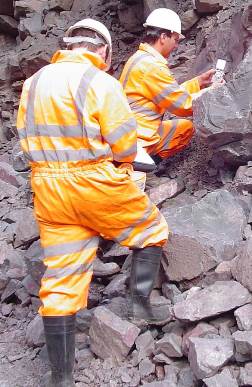
Picture, left: Obtaining rock-mass data upon which to perform geotechnical assessments involves discontinuity mapping of near vertical and heavily fractured rock faces.
Advancements in long-range high-definition terrestrial LiDAR systems (TLS) and unmanned aerial systems/vehicles (UAS / UAV’s, commonly termed ‘drones’) coupled with falling costs has enabled remote and thus much safer surveying, geological and geotechnical mapping solutions to be adopted in the UK Quarrying Industry. This was recognised at the Mineral Products Association’s National Safety Awards held at BAFTA in London in November 2013.
However, the use of these integrated systems is not just limited to the UK Quarrying Industry. They are applicable to any geoscience application where access is difficult or hazardous, and they have been successfully used for surveying and mapping inaccessible coastlines, high alpine cliffs and sink-holes.
Mapping
Many features and comments in Geoscientist have expressed the continuing need for field mapping in the modern age and the importance of doing so. I could not agree more with those sentiments. However, the very nature of many of the mountainous and coastal cliffs that we need to map pose potentially serious hazards and an associated high risk to those collecting data. This is especially true in the quarrying industry, where obtaining rock-mass data upon which to perform geotechnical assessments involves discontinuity mapping of near vertical and heavily fractured rock faces.
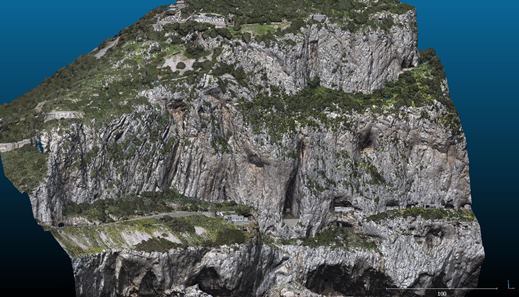
Picture, right: Photogrammetric surveys comprise a series of data points that can be georeferenced into real world coordinates and attributed a colour from the overlapping photographs generating an XYZ RGB point-cloud.
 Point-cloud surveys collected by long-range high-resolution LiDAR and by photogrammetric techniques from either terrestrial set-ups (tripods, fixed stations or vehicle mounted) or mounted from aircraft provide exceptionally high quality 3D models from which topographic, geological and geotechnical information can be extracted without the need to approach the rock-face. As well as being collected more safely, a permanent record of the feature being mapped is made available for further interpretation at a later date, should further corroborative data be obtained.
Point-cloud surveys
Both photogrammetric modelling and LiDAR laser scanning produce a survey or 3D model comprising many thousands or even millions of data points. These models are commonly referred to as ‘point clouds’.
Both systems can be either obtained terrestrially from upon the Earth’s surface or from aircraft. In the case of the aerially mounted systems the use of ‘Drones’ are becoming increasingly frequent with several ‘Drones’ being able to carry LiDAR scanners as well as high quality digital cameras.
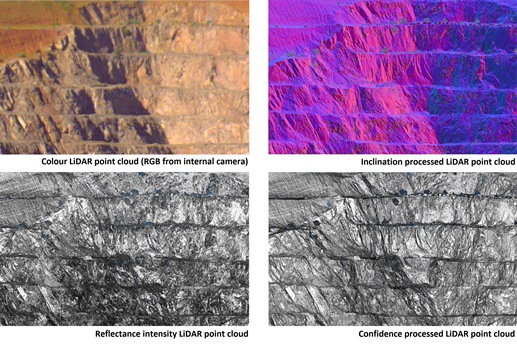 Picture, left: A LiDAR point-cloud as captured in RGB and Reflectance Intensity (left) and post processed into Inclination and Confidence (right).
Photogrammetric surveys comprise a series of data points that can be georeferenced into real world coordinates and attributed a colour from the overlapping photographs generating an XYZ RGB point-cloud.
LiDAR scanners generate point-clouds that can be similarly georeferenced into real-world coordinates. Cheaper LiDAR scanners simply record the flight-time and bearing of the photons and provide a monochrome XYZ point-cloud. However more expensive scanners will also record the reflectance intensity of the photon being returned; and if also equipped with a digital camera, then an RGB value can be ascribed to the point in the resultant point-cloud. This generates a similar 3D model, as a photogrammetrically derived point-cloud.
However, adding reflectance intensity adds another dimension useful to a geologist – because harder brighter materials (buildings and granites, for example) reflect more than softer duller materials (vegetation and clays) do. Distance also affects reflectance intensity – because the further the photon has to travel, the weaker its eventual received response will be.
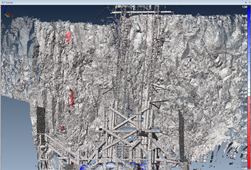
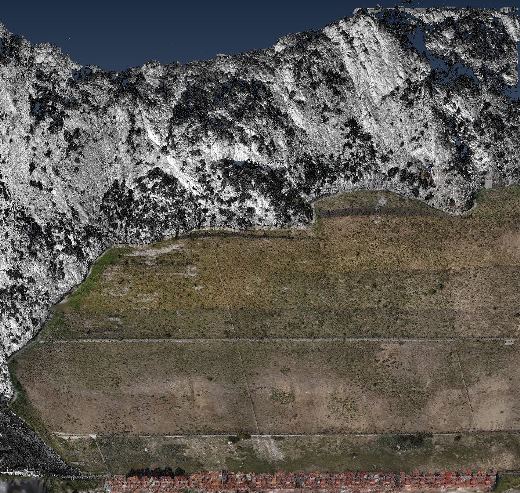 Picture, right: Composite of terrestrial LiDAR data merged with UAS photogrammetric data are shown in Figure 4 and is of the Limestone coastal cliffs shown in the photograph
Software is available that can compensate for distance-based variations in intensity and can also calculate the angle of incidence of the photon striking the object being scanned. This enables points with a similar orientation to be coloured with similar RGB values and makes the identification of joint planes easier to identify.
By comparing the distance-compensated reflectance intensity with the angle of incidence of the reflected photon, a “confidence” value can be ascribed to the point. Low reflectance and tangential angles of incidence are ascribed lower confidence values than those with high reflectance, striking the feature perpendicularly. Manipulation of the point-cloud in this manner generally enables block-edges to be more readily identified. In general terrestrial systems obtain a better model of sub-vertical features and aerial systems obtain a better model of sub-horizontal features (pictures).
Drones
Laws governing the use of drones are awash with anachronisms and abbreviations, such as: ‘Unmanned Aerial Vehicles’ (UAV), ‘Unmanned Aerial System’ (UAS), ‘Small Unmanned Aerial System’ (SUAS) and ‘Remotely Piloted Aircraft System’ (RPAS). In general, if it is carrying a payload (such as a camera, LiDAR, etc.) then it is a ‘system’. Otherwise, it’s a simple ‘vehicle’. Stringent legal requirements must be adhered to when operating a drone, in the UK and in many other national airspaces around the world. We have had experience in the UK, Republic of Ireland, Gibraltar, France and are currently seeking permission in Canada.
 In the UK, the first requirement is that the Operator (whether ‘Sole Trader’ or ‘Company’) must possess a “Permit to Undertake Aerial Work” issued by the Civil Aviation Authority (CAA). In order for such a permit to be issued, the operator must have an Operations Manual, detailing all the equipment being used and the capabilities of the staff operating it. To that end, all pilots must be able to demonstrate a recognisable level of knowledge of aviation law and aircraft handling competence. In most cases this will involve the pilot, who has passed the BNUC (Basic National UAS Certificate) ground course and practical flight examination, actually using the equipment they wish to fly.
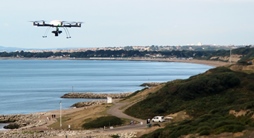
Picture, left: The drone shown has the LUASSTM registration number GUAV-0180 – see text.
The drone itself also needs to be independently assessed (usually, at the same time as the flight test) and be issued with a LUASSTM (Light UAS Scheme) Registration Number. The drone shown in the picture, for example, has the registration number GUAV-0180.
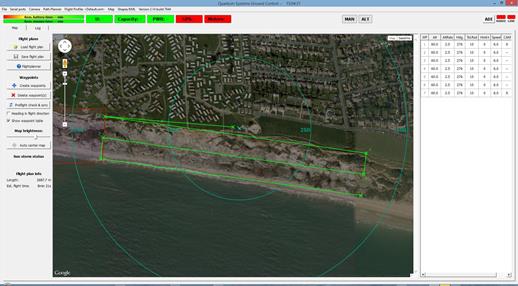 Picture, right: An example of flight planning for one of the four flights over the coastal erosion site featured in earlier pictures.
Finally, the operator needs to have an acceptable level of Third Party Liability Insurance cover. Once all of these conditions have been met, the Operator can legally undertake aerial work. Following the issue of a permit, UAS Pilots are also required to log their flights and keep a log of the battery discharge and recharge (in effect, the equivalent of an engine maintenance log). These records are submitted annually to EuroUSC, the body which administers the examination and documentation on behalf of the CAA.
In terms of the practicalities of flying, most UAS Operators fly under Visual Line of Sight (VLOS) criteria - being a ‘cylinder’ of airspace with a radius of 500m and a height above take-off of 400 feet (~120m) while retaining a clear line of sight to the drone. This can make planning flights a challenging process, especially in areas of great vertical relief.
For example, it took two pilots six hours to plan the four flights necessary to scan the sea cliffs shown in the picture. An example of flight planning is shown in the accompanying picture. It shows that the UAS had a planned flight height of 60m and air speed of six metres per second (12knots) and flew a total length of 2788 linear metres in eight minutes and 21 seconds, covering a section of coastline 800m long and 200m wide.
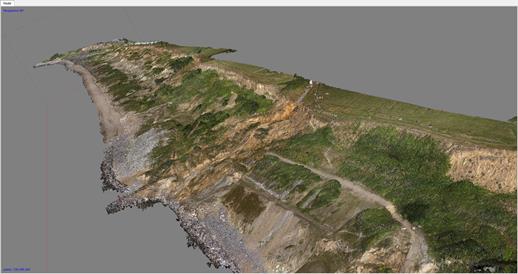 Picture, left: Point-cloud model of the coastal erosion survey shown in earlier pictures.
Mapping the sea cliffs shown in the picture would have been a difficult, laborious and potentially hazardous process without the resultant point-cloud 3D model obtained by the UAS. In a similar manner, surveying and undertaking geomorphological mapping of the saturated clays failing along the coastline shown in the picture would also have been difficult using traditional terrestrial-based surveying and mapping techniques. The safety element, coupled with the acquisition-time benefit, is immediately apparent.
Application
Our surveyor recently joked that he now pushes his mouse harder than his legs since we started obtaining, processing and analysing point-cloud surveys. I am sure he exaggerates - but I can appreciate his sentiment! Where a traditional survey would have entailed several days in the field (and maybe a day processing), we frequently find that up to a day is spent planning a survey, less than a day actually doing it – followed by several days processing the data on a high powered PC running 256GB of RAM.
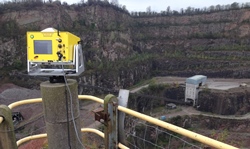
Picture, right: A fixed survey station on the edge of a quarry.
 However, the resultant 3D models are invaluable. The picture shows a point-cloud model of the coastal erosion survey shown in earlier photos. It comprises 730,445,364 points each with an XYZ RGB value. From this model, geomorphological mapping can be undertaken, and cross-sections obtained, upon which to base slope-stability analyses. By comparing successive surveys, rates of retreat along any part of the slope can be determined - either toe erosion by the sea or crest break-back as the toe erodes and the slope fails.
Other examples of geo-hazards being mapped in this way are crown holes, sink holes and old lead rakes, all being mapped using the UAS derived photogrammetric techniques.
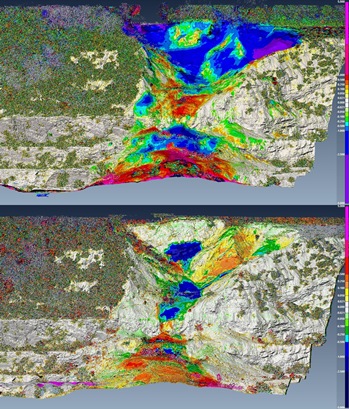 Picture, left: Monitoring a failure using LiDAR from a similar fixed station. Changes as low as 21mm can be determined. These have proved that further deformation of the limestone veneer is not taking place. Isolated small rock-fall events have been detected.
Mass movement (such as the coastal erosion described above) can be monitored using UAS-derived photogrammetry; but where smaller movements are expected, terrestrial LiDAR mounted on fixed survey stations enables finer monitoring to be undertaken.
I the pictures you can see a fixed survey station on the edge of a quarry, and monitoring of a failure using LiDAR from a similar fixed station. This failure occurred several years ago during a particularly wet winter. Swelling of the mudstones caused the retaining veneer of limestone to fail. Since then, the failure has been monitored quarterly and the rates of movement calculated.
In recent months, the rates have been shown to be declining (fewer colour changes in the lower image than the upper image). The scanner is able to obtain survey points 34mm apart at a range of 1700m and at the range of the monitoring example (approximately 350m) changes as low as 21mm can be determined and has proved that further deformation of the limestone veneer is not occurring but has picked up isolated small rock-fall events.
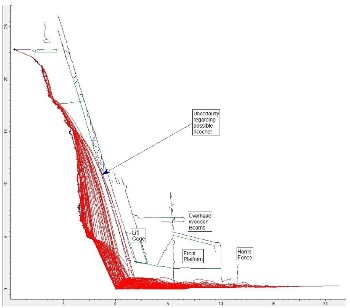 Picture, right: Rock fall predictions for the quarry shown below
The use of the LiDAR has enabled rock-fall predictions (see diagram) to be carried out on a particularly well-known film set in a dormant UK quarry (pictured). While Mance Rayder and his army of Wildlings and Giants add to the hazards of manning ‘Castle Black’, rock-fall was one hazard that was decidedly not acceptable. The risk was ameliorated by designing a rock-trap into the rear of the Castle, against the rock face. Subsequent annual LiDAR rock-fall monitoring has been undertaken to ensure the efficacy of the rock-trap design and to calculate the volumes of rock-fall occurring (picture). (For the uninitiated, who have been mystified by my references, the fim-set is for HBO’s hugely popular Game of Thrones series.)
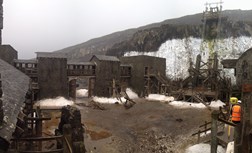 Picture, left: A well-known (to devotees of Game of Thrones) film set in a dormant UK quarry
Keeping with the theme of engineering geology, discontinuity data (dip, and dip direction) and extrapolation of those discontinuities as planes, can all be undertaken on a point-cloud survey. Numerous software packages enable Dip/Dip Direction data to be automatically determined or individually digitised and calculated.
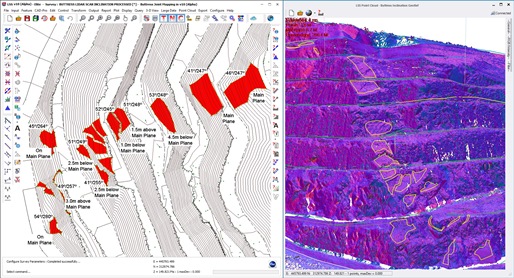
 Picture, right: Annual LiDAR rock-fall monitoring has been undertaken to ensure the efficacy of the rock-trap design and to calculate the volumes of rock-fall occurring.
The final pair of pictures show: a series of joint planes being digitised and the joint orientations determined on an “inclination” processed LiDAR point-cloud, and extrapolation of this failure plane and of two joint planes forming a wedge failure at another quarry location. The real advantage in this type of discontinuity-analysis is plain to see: not only is the dip and dip-direction recorded, but so is its geographic location within the point-cloud survey.
 Point-cloud surveys provide a safely-acquired 3D model, upon which subsequent geological and geotechnical mapping can be undertaken. While no remote mapping can wholly substitute the ‘Mk.1 eyeball’, they do provide valuable data in a form that can be re-interrogated again later, and can provide data in areas difficult or hazardous to access.
Picture, left: A series of joint planes being digitised and joint orientations determined on an “inclination” processed LiDAR point-cloud.
* Adrian Wilkinson is Geotechnical Director at Land and Minerals Consulting Limited based in Clevedon, North Somerset, UK. All information correct at time of writing, but under constant legislative review.