Meaningless data are tough words to swallow. John Armitage and Tom Coulthard argue that Earth scientists must face up to the fact that some observations might be an aggregation of seemingly random events, where there is no cause and effect.

Research suggests that humans have an innate difficulty in recognising genuinely random data. Experiments using streams of randomly generated binary sequences show a propensity for people to believe random data fluctuates more than it actually does (Goodfellow, J.
Experimental Psychology 1938; Kahneman & Tversky,
Psychological Review 1973; Falk & Konold,
Psychological Review 1997). A more mainstream example of this is termed gamblers fallacy, where lucky or unlucky streaks are identified in the random selection of red or black on a roulette wheel.
Humans can also be influenced by a pre-existing idea or narrative. In their 1973 study, Israeli psychologists Kahneman and Tversky asked college students to rank a list of 9 subjects that an intelligent but non-creative, fictitious character, Tom W., would most likely study.
The majority of those surveyed, on the basis of his character description, chose computer science, but statistically Tom W. would be most likely to study humanities—the most popular college course. Studying early onset psychosis, the German psychiatrist Klaus Conrad noticed patients reporting false meanings in their surroundings, for example feelings of repeatedly being watched, talked about or followed. He termed this process Apophänie or Apophenia (Mishara,
Schizophrenia Bulletin 2009), the experience of seeing meaningful patterns or connections in random or meaningless data.
Of course, good Earth scientists may believe that they are not swayed by past scientific work and that they objectively view rock outcrops to make their own interpretations. As many facets of Earth science involve interpretation of data, we argue that the persuasiveness of a narrative and human difficulties in recognizing genuinely random data can lead to apophenia, and we will use examples to illustrate this problem. We urge Earth scientists to test their interpretations. As the old adage goes, correlation does not mean causation.
Sequence stratigraphy
Sequence stratigraphy relies heavily on causality—with changes in sedimentary deposits linked to drivers such as climate, tectonics, or base/sea level changes. The underlying physics for this causality (changes in energy gradients) are sound. However, river basin processes such as erosion and deposition are non-linear in their response to drivers such as climate and tectonics, and are also contingent upon the prior history of events in a basin—via sediment storage effects for example.
Such complexity has recently led researchers to suggest via field studies, laboratory and numerical models (Jerolmack & Paola,
Geophys. Res. Letters 2010; Van de Wiel & Coulthard,
Geology 2010; Phillips & Jerolmack,
Science 2016) that river basins can filter and destroy, or shred certain signals from environmental drivers.
Furthermore, the internal or autogenic processes of erosion and deposition can generate chaotic sediment signals equivalent in magnitude to those from external drivers. Outside of river basins, numerical and laboratory experiments (e.g. Burgess & Prince, Basin Research 2015) show that shoreline migration, too, can be a consequence of various external and internal processes within the sedimentary system. That is, it now seems that some stratigraphic patterns typically attributed to external drivers can be created by the sedimentary systems themselves.
Put simply, scientists may want to see signals and patterns in the data, which biases us from determining there are none. As the theoretical physicist Richard Feynman stated “the first principle is that you must not fool yourself—and you are the easiest person to fool”.
Sample irregularity
The correlation between stratigraphic records and the drivers of, for example, climate change expose one central issue in Earth science: the irregularity of the spacing of samples in time. Irregular/infrequent data are not unique to sedimentology and can generate issues with how we test correlations and interpret them.
For example, the history of Icelandic volcanic eruptions creates an exceptional record of lava composition going back into the Pleistocene (Figure 1; Gee et al., Earth Planet. Sci. Lett. 1998; Eason et al., Bullet. Volcan. 2015). At around 10,000 years ago, the ratio of niobium (Nb) to zirconium (Zr) reduces significantly, and this coincides temporally with rapid deglaciation at the end of the Pleistocene. It is tempting to causally relate the two and create a narrative that climate change influences volcanism.
By generating this narrative, we could fall into a trap. The data set from Iceland is irregularly distributed in time, with large gaps. The number of samples is small, at around 300. To test for correlation against a climate record requires resampling the irregular data into some regular time series, and in doing so we make potentially misleading statistics.
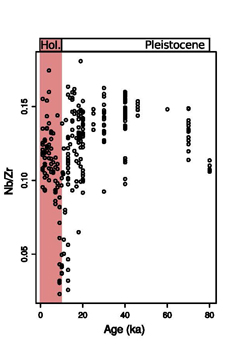 Fig.1, Time series data from Iceland. Observed Nb/Zr ratio from lavas erupted in Iceland during the Holocene and Pleistocene (with age in thousands of years, ka) (Data from Gee et al., Earth Planet. Sci. Lett.1998; Eason et al., Bullet. Volcan. 2015).
To illustrate this point, we’ve taken two random distributions. By re-sampling the data to allow for correlation tests, we can obtain statistical correlations (Figure 2). By testing for correlation we are in effect reducing the sample size and biasing this sample towards the mean. This increases the degree of correlation, but reduces the statistical power. At first glance, we would not believe that the two random samples are not correlated, but resampling has in effect made them so.
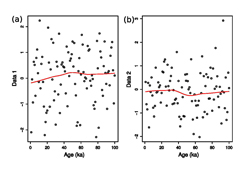 Fig. 2, Irregular time series data. Two random distributions and their associated smoothed trends in relation to age. In this example the correlation coefficient between the two distributions is -0.64: they are strongly anti-correlated.
Avoiding apophenia
The point is that data and observations can have gaps. To make the leap from the measured data to an understanding of the processes behind them requires interpretation. This is when apophenia is at its most dangerous, and recent research suggests that Earth scientists may not be so good at making correct interpretations. Bond et al., (
Geology 2012) asked 184 tectonic geophysicists to interpret a synthetic seismic section generated using a geological model, so that the subsurface processes and final geometry were known.
The researchers found that only one third of those tested came up with the correct interpretation. Whilst this is a specific seismic example, it is easy to draw parallels to other forms of interpretation in Earth science. It is human nature to seek causality, and it is in our nature to ignore statistical reasoning. Within a discipline that is often data-poor, interpretation to fill in data gaps is seductive, but the interpretation maybe inappropriate or incorrect. So how can we avoid apophenia?
We suggest one solution lies in predictive models. To illustrate our point, we could look at a 2016 study in Science by McKenzie and colleagues, which attempts to draw a correlation between past atmospheric CO2 fluctuations and global plate tectonics. They analyse the uranium-lead (U-Pb) ages of detrital zircons found in sediments globally, and use this as a proxy for volcanism, assuming that peaks in zircon production reflect periods of active continental arc magmatism. The peaks in periods of young zircons ages look visually correlated with periods of high atmospheric CO2 concentrations going back through the Cretaceous, but no statistical test was done because the CO2 proxies are irregularly spaced in time.
The researchers concluded that the high atmospheric CO2 concentrations were due to increased back-arc volcanism during periods of widespread subduction. To test this narrative requires the development of a forward model of global plate tectonics, linked to a climate model, to explore how the change in back-arc volcanism impacts CO2 release. When this was done by Brune and colleagues (Nature Geoscience 2017), it was discovered that increased CO2 fluxes related to rifting and continental divergence (rather than arc volcanism) created a closer fit to the observed CO2 time series.
Debates about the causes for past climatic change and how it is recorded within the geological record will likely continue. But we are concerned that too much is left to interpretation. It is human nature to be biased and to have little statistical intuition (Kahneman, 2011), yet we can avoid apophenia by using laboratory and numerical models to test hypotheses against observations. This is not an easy task, given the complexity of Earth processes, and brings in another debate about the heuristics that might be required to build suitable models. The road to recovery, however, first lies in recognizing theproblem—otherwise we risk publishing meaningless correlations.
John Armitage is a Research Scientist at the Institut de Physque du Globe de Paris (email:
[email protected]) and Thomas Coulthard is a Professor of Physical Geography at Hull University (email:
[email protected]).
Further reading
Bond, C. E. et al. (2012) What makes an expert effective at interpreting seismic images?
Geology 40, 75-78.
Brune, S. et al. (2017) Potential links between continental rifting, CO2 degassing and climate change through time.
Nature Geoscience 10, 941-946.
Burgess, P. M. & Prince, G. D. (2015) Non-unique stratal geometries: implications for sequence stratigraphic interpretations.
Basin Research 27, 351-365.
Eason, D. E. et al. (2015) Effects of deglaciation on the petrology and eruptive history of the Western Volcanic Zone, Iceland.
Bulletin of Volcanology 77, 47.
Falk, R. & Konold, C. (1997) Making Sense of Randomness: Implicit Encoding as a Bias for Judgment.
Psychological Review 104, 301-318.
Gee, M. M. et al. (1998) Glacioisostacy controls chemical and isotopic characteristics of tholeiites from the Reykjanes Peninsula, SW Iceland.
Earth and Planetary Science Letters 164, 1-5.
Goodfellow L. D. (1938) A Psychological Interpretation of the Results of the Zenith Radio Experiments in Telepathy.
Journal of Experimental Psychology 23, 601-632.
Jerolmack, D. J. & Paola, C. (2010) Shredding of environmental signals by sediment transport.
Geophysical Research Letters 37, L19401.
Kahneman, D. (2011) Thinking, fast and slow. New York: Farrar, Straus and Giroux. 499p.
Kahneman, D. & Tversky, A. (1973) On the psychology of prediction.
Psychological Review 80, 237-251.
McKenzie, N. R. et al. (2016) Continental arc volcanism as the principal driver of icehouse-greenhouse variability.
Science 352, 444-447.
Mishara, A. L. (2009) Klaus Conrad (1905–1961): delusional mood, psychosis, and beginning schizophrenia.
Schizophrenia Bulletin 36, 9-13.
Phillips, C. B. & Jerolmack, D. J. (2016) Self-organization of river channels as a critical filter on climate signals.
Science 352, 694-697.
Tversky, A. & Kahneman, D. (1973) Availability: A heuristic for judging frequency and probability.
Cognitive Psychology 5, 207-232.
Van De Wiel, M. J. & Coulthard, T. J. (2010) Self-organized criticality in river basins: Challenging sedimentary records of environmental change.
Geology 38, 87-90.
Top image: Paul IJsendoorn (https://stocksnap.io/photo/TB2R3H1H7O)