Andy Alvey, Alan Roberts* and Nick Kusznir discuss how a new global map of crustal thickness is illuminating complexity in plate tectonic restorations
Mapping the thickness of Earth’s crust, on land and in the oceans, allows us to understand fundamental geological and geographical observations, such as the location of mountain belts and the depth of the oceans. Over the past 10 to 15 years, companies interested in deepwater oil-and-gas exploration have also taken a close interest in how crustal thickness and crustal type (continental, oceanic or mixed-transitional) are distributed around the continental margins of the world’s oceans and bordering seas. The particular focus of this interest has been to understand the thermal consequences of stretching and thinning the continental crust and lithosphere to form new ocean basins.
Our understanding of the processes that lead to the formation of ocean basins and their continental margins has evolved significantly over the last 20 years, or so, and has been the focus of several previous Society Special Publications (SPs 167, 187, 282, 369, 476 between 2000 and 2018).
Over the course of many commercial studies, we have undertaken our own mapping of crustal thickness and crustal type around many of the world’s continental margins and their associated sedimentary basins. We aimed to provide constraints on crustal structure and crustal type as an aid to deepwater exploration. We continued mapping in order to produce a new global map of crustal thickness (Fig. 1). This map shows the first-order distribution of crustal-basement thickness (continental and oceanic) around the whole planet. It is derived from recent satellite-acquired gravity anomaly data in combination with innovative geophysical techniques. The colours in the map represent the thickness of the crustal-basement. The overlying texture in the map (and all other maps) is a shaded-relief display of the gravity data, which highlights major tectonic features, both onshore and offshore. This map advances on the pioneering seismological mapping of the 1990s by being much higher resolution, courtesy of the global coverage of satellite gravity data (see Further Reading).
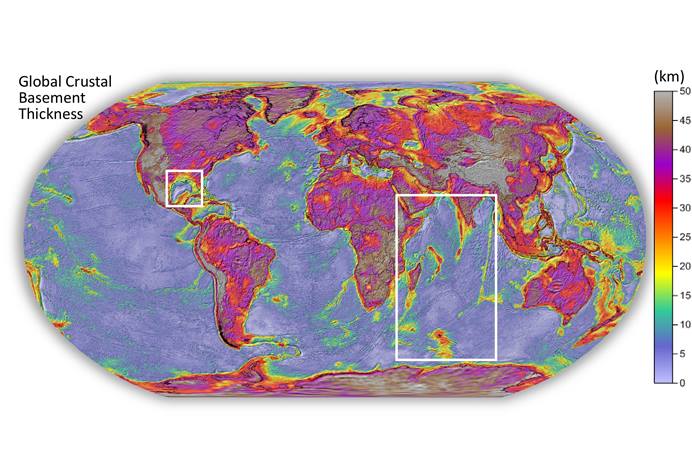
Fig. 1: Global map of crustal-basement thickness (continental and oceanic) derived by OCTek gravity inversion. The map is overlain by a shaded-relief display of the gravity anomaly data, which enhances the underlying tectonic features. Gulf of Mexico and Indian Ocean highlighted.
Gravity inversion
The crustal-thickness map is the product of a geophysical modelling technique, which has acquired the shorthand name OCTek gravity inversion (Ocean Continent Transition Tectonics). Input to the modelling comprises satellite free-air gravity anomaly data, topography/bathymetry data and information about sediment thicknesses above crustal basement. Global coverage for each is freely available in the public domain.
An illustrative summary of the modelling workflow is provided in figure 2. The modelling is iterative, seeking first to determine Moho depth and from that to determine crustal thickness and type. For any given set of input parameters and assumptions made, the model will converge to a unique solution for Moho depth.
Further technical details of the modelling technique can be found within the Further Reading, but it is worth drawing attention to two aspects that are distinctive and make the approach particularly suitable for investigating ocean basins and their margins (Fig. 2): (1) the modelling calculates and incorporates the high geothermal gradients and corresponding decreased densities that result from thinning the continental crust and lithosphere, leading to the formation of an ocean basin; (2) as a consequence of quantifying continental thinning, the modelling can predict how much new magmatic crust (oceanic crust in the oceans) is likely to be present at any given location, such that the total thickness of the crust can be divided into old-continental and new-magmatic components.
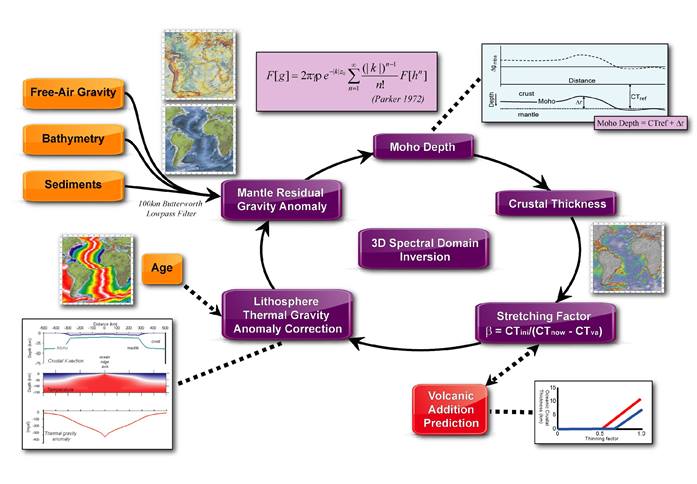
Fig. 2: Schematic outline of the OCTek gravity inversion method to determine Moho depth, crustal-basement thickness and lithosphere thinning-factor, using gravity anomaly inversion incorporating a lithosphere thermal correction and prediction of magmatic addition to the crust. Figure modified from Roberts et al. Petroleum Geoscience 19, 65-88 (2013) and Kusznir et al. In: McClay, K.R. & Hammerstein, J.A. (eds) Passive Margins: Tectonics, Sedimentation and Magmatism, Geological Society, London, Special Publications 476 (2018).
The global map resolves the majority of known oceanic areas with a crustal thickness of about 5 to7 km, that is, normal-thickness oceanic crust. Exceptions to this are: (i) known volcanic plateaus such as Iceland, Kerguelen and Ontong-Java; (ii) hotspot trails such as those in the Pacific, the Walvis Ridge in the Atlantic and the 90°-East Ridge in the Indian Ocean; (iii) micro-continental blocks such as Jan Mayen, the Seychelles-Mascarenes and possibly several others.
Onshore crustal thickness has a ‘typical’ value of about 37.5 km, with thicker crust delineating the major orogenic belts and also the thick cratonic crust of Africa. Onshore crust thinner than about 37.5 km typically delineates intra-continental rift basins, many of which also extend offshore and link into the thinned crust of continental margins. We would advise against taking the onshore results too literally, in terms of precise values, but we believe the first-order results to be reliable.
Plate tectonic models
Maps of crustal thickness can be used to help constrain and modify plate-tectonic models. Traditionally plate restorations use present-day geomorphic features, such as coastlines and shelf-breaks as their continental constraint. Such features, however, evolve with time and are not necessarily in the same relative position now as they were at the time of continental separation. By using a map of crustal thickness to constrain the plate restorations we can restore a property of Earth’s crust which, at continental margins, was actually produced by the process of continental breakup.
We have illustrated this here with two examples that involve a more complex plate-restoration sequence than the traditionally-illustrated closing of the Atlantic. They are the Gulf of Mexico (Fig. 3) and the Indian Ocean (Fig. 4).
The Gulf of Mexico
The first map for the Gulf of Mexico (Fig. 3a) shows a central oceanic core of the Gulf picked out by crust about 5 to 7 km thick (blue) and flanked on all sides by the thicker continental crust of North America, Mexico and Cuba. An important feature of this map is that the textured overlay of the gravity data picks out the fossil spreading-centre and offsetting, arcuate transform-faults within the Jurassic oceanic crust. This is seen even more clearly in the inset map in which the shading has been further accentuated.
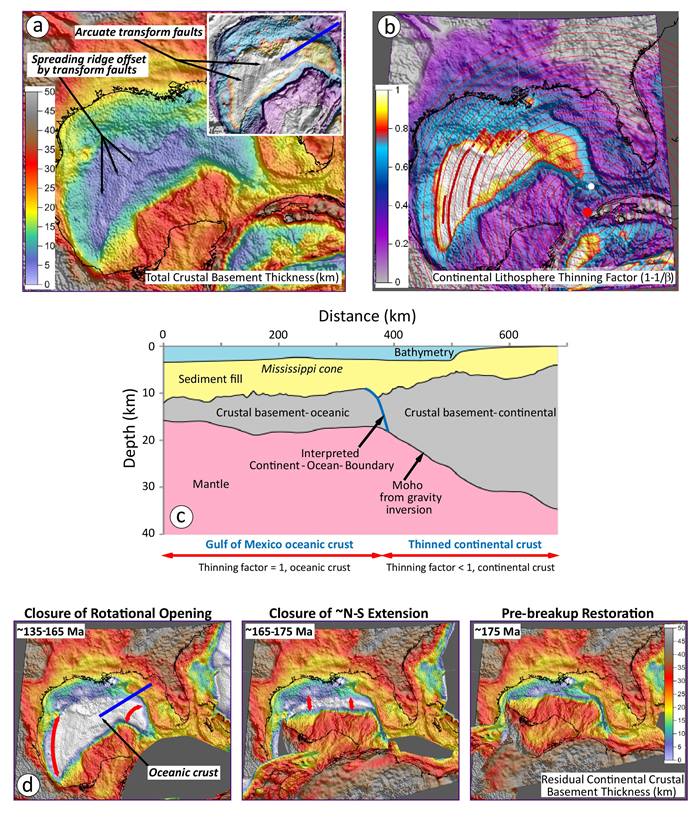
Fig. 3: Gulf of Mexico. (a) Map of crustal-basement thickness. Main and inset map with enhanced shading show an extinct Jurassic spreading ridge and associated transform faults. (b) Map of continental lithosphere thinning-factor. Small-circles of plate motion, centred on red pole of rotation, are aligned with the oceanic transform faults. (c) Crustal cross-section from NE Gulf of Mexico, extracted from gravity model results. Section located as blue line in Figs 3a&d. (d) Two-stage plate-restoration for the Gulf of Mexico. Rotational closure, preceded by N-S closure produces the Jurassic pre-breakup restoration.
The importance of recognising transform faults is that these allow us to define the direction of plate motion during sea-floor spreading and opening of the Gulf of Mexico. The fact that they are visibly arcuate means that the pole of rotation for opening must lie nearby.
The second map for the Gulf of Mexico (Fig. 3b) shows another result from the gravity inversion, related to crustal thickness, known as continental lithosphere thinning-factor. This is a measure of how much the continental crust and lithosphere have been thinned by the process of rifting and breakup. A value of 0 means no thinning, a value of 0.5 means thinning to half its original thickness, a value of 1 means complete thinning and replacement by oceanic crust (white on the map). Overlain on this map are a set of concentric circles that have been constructed to align with the arc of the transform faults. At the centre of the concentric circles (red circle) lies the associated pole of rotation for the opening of the Gulf of Mexico. This pole of rotation is different from the ‘traditional’ location (white circle) and results in a modified opening history for the basin. The traditional pole does not align with the arcuate transform faults imaged by the gravity modelling.
A cross-section extracted from the results of the gravity modelling is shown in figure 3c (located in Figs. 3a&d and coincident with the track of a regional deep-seismic profile). The cross-section shows bathymetry and sediment fill, both of which are input to the model, underlain by crustal basement and mantle, separated by the Moho. The Moho is predicted by the gravity model and from the position of the Moho the model predicts the thickness of crustal basement. Further interpretation of the results, looking at the distribution of both thinning-factor and new magmatic crust, allows us to predict the position of the continent-ocean-boundary and the location of continental and oceanic crust on either side.
The final set of figures for the Gulf of Mexico (Fig. 3d) shows a new restoration sequence for the basin, which uses the new pole of rotation associated with the oceanic transform faults. Step 1 closes the basin along the transform faults (about 135 to 165 Ma) until the offshore continental margins of Florida and Yucatan (Mexico) come into contact. This rotational restoration removes most, but not all, of the oceanic crust within the Gulf of Mexico. Step 2 shows that a narrow approximately E-W band of oceanic crust remains at about 165 Ma, which must be closed by a S-N motion of the Yucatan/South American block, producing the final pre-rift restoration of Step 3 at about 175 Ma. Honouring the arcuate transform faults requires the Gulf of Mexico to have opened as a two-stage process, the first involving N-S rifting of Yucatan/South America away from North America, the second involving rotational opening around a local pole, rotating Yucatan away from North America.
The Indian Ocean
Crustal thickness within the Indian Ocean, as shown in the first map (Fig. 4a) is of particular interest because of the many blocks of thicker crust that sit within the background setting of a major ocean. The largest of these is the island of Madagascar, which is a continental block known to have separated in a south-southeast direction away from Somalia during the Jurassic. The affinity of some of the other regions of thicker crust is, however, less obvious.
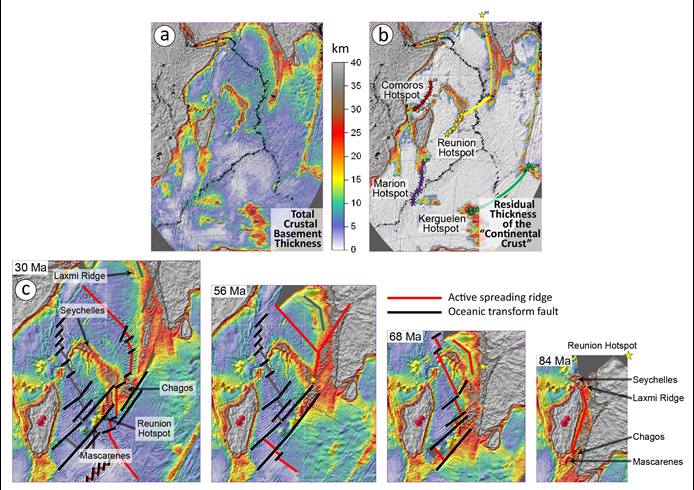
Fig. 4: Indian Ocean (a) Map of crustal-basement thickness. Within the oceanic area there are many areas of anomalously thick crust. (b) Map of the residual thickness of the ‘continental crust’. The tracks of four known volcanic hotspots are shown, they are associated with areas of anomalously thick crust. (c) Four stages in the closure of the northern Indian Ocean, reassembling a single continental block by 84 Ma.
The second map for the Indian Ocean (Fig. 4b) displays the residual thickness of the ‘continental’ crust. This is produced by subtracting the predicted new magmatic crust from the original map of total crustal thickness. This ‘cleans up’ the major oceanic areas (white, no continental crust), but numerous blocks of coloured, thicker crustal basement remain.
Also shown on this second map are the known tracks, relative to the present-day plate configuration, of four major volcanic hotspots (Reunion, Comoros, Marion, Kerguelen). Any regions of anomalously thick crust that lie on, or close to, one of the hotspot tracks can therefore be ascribed a likely volcanic origin. There remain other blocks of thick crust, such as the Seychelles, Laxmi Ridge and the southern Kerguelen Plateau, which are not associated with hotspot trails and are therefore likely to be microcontinental blocks. Precambrian granites are known in the Seychelles and so its continental affinity is well known. Precambrian zircons have also recently been recorded from Mauritius (within the Mascarenes area), leading to a suggestion that part of the Reunion hotspot trail may also be associated with a microcontinental fragment (Mauritia, see Further Reading).
The third set of figures, for the northern Indian Ocean (Fig. 4c), shows a new set of plate restorations back into the Late Cretaceous, at which time Madagascar, the Seychelles, India and their associated microcontinental blocks are all reassembled to a single continental block. The starting point for the restoration is the initial map of present-day crustal-basement thickness. The first-order sequence of closure in these restorations is not new and follows much previous work. In places, however, local details have been changed in order to honour tectonic features highlighted by the new crustal-thickness map and also to take account of the potential crustal fragments, which only a map such as this can show.
The restoration sequence shows that as the Arabian Sea is closed between the Seychelles and India, so the Chagos block comes to settle into the re-entrant of the Seychelles-Mascarenes block at about 30 Ma, closing oceanic linkage across the Reunion hotspot trail, as highlighted at 56 Ma. Full closure of the Arabian sea by 68 Ma brings together the continental blocks of the Seychelles and Laxmi Ridge, while oceanic crust still separates Madagascar from the Seychelles.
Finally, by 84 Ma, the four separate continental blocks/fragments of Madagascar, Seychelles, Laxmi Ridge and India have all been reassembled to a single pre-breakup continent. Sandwiched between Madagascar and India are remnants of the Mascarene-Chagos-Maldives track of the Reunion plume, which the recent zircon work, supported by the results of the gravity inversion, suggests may contain several dismembered (here reassembled) microcontinental blocks in addition to the known volcanic material.
Multi-purpose crustal mapping
The plate restorations illustrated here are two of many that have been produced from the results of the global crustal-thickness mapping. Such restorations hopefully stimulate a primary academic interest for most geoscientists, provoking memories of bygone lectures in a newly illuminating light. Plate restorations also have an applied context, however, in that they are frequently used to constrain models for reservoir and source-rock deposition on deepwater continental margins, as well as providing a predictive framework for models of past oceanic circulation and palaeoclimate modelling.
Away from plate restorations, mapping crustal thickness and the distribution of crustal type has many other applied uses, such as: constraining continental limits for the law-of-the-sea; assisting with the planning and location of expensive deepwater seismic surveys for both hydrocarbon exploration and academic purposes; assisting with the interpretation of deep-seismic reflection and refraction data, by constraining Moho depth; and providing the basic input for petroleum-systems models.
All of this can be achieved using data that are freely available in the public-domain. Although illustrated here at the global/regional scale the OCTek technique is equally applicable down to the scale of individual basins, where confidence in the results can be improved by the input of local geological information and knowledge.
Acknowledgements: The maps within this article were originally presented as a poster at the Society’s ‘Plate Tectonics at 50’ conference in October 2017. The full poster can be viewed here. The plate restorations were performed in the open-source software GPlates (www.gplates.org). We thank Rob Pascoe for permission to use the cross-section in figure 3c, constructed along the track of SuperCache Line 3200.
Authors: Andy Alvey1, Alan Roberts1* and Nick Kusznir1,2
1. Badley Geoscience Ltd, North Beck House, North Beck Lane, Spilsby, Lincs, PE23 5NB, UK; 2. University of Liverpool, Department of Earth & Ocean Sciences, Liverpool L69 3BX, UK; *Correspondence [email protected]
Download the article pdf here
Further Reading
Alvey, A., Gaina, C., Kusznir, N.J. & Torsvik, T.H. (2008) Integrated crustal thickness mapping and plate reconstructions for the high Arctic. Earth and Planetary Science Letters, 274, 310-321.
Chappell, A.R. & Kusznir, N.J. (2008) Three-dimensional gravity inversion for Moho depth at rifted continental margins incorporating a lithosphere thermal gravity anomaly correction. Geophysical Journal International, 174, 1–13.
Kusznir, N.J., Roberts, A.M. & Alvey, A.D. In press (2018) Crustal structure of the conjugate Equatorial Atlantic Margins, derived by gravity anomaly inversion. In: McClay, K.R. & Hammerstein, J.A. (eds) Passive Margins: Tectonics, Sedimentation and Magmatism, Geological Society, London, Special Publications, 476.
Mooney, W.D., Laske, G. & Masters, T.G. (1998) CRUST 5.1: A global crustal model at 5°x5°. Journal of Geophysical Research, 103, 727-747.
Roberts, A.M., Kusznir, N.J., Corfield, R.I., Thompson, M. & Woodfine, R. (2013) Integrated tectonic basin modelling as an aid to understanding deep-water rifted continental margin structure and location, Petroleum Geoscience, 19, 65-88.
Sandwell, D. T. & Smith, W.H.F. (2009) Global marine gravity from retracked Geosat and ERS-1 altimetry: Ridge Segmentation versus spreading rate, Journal of Geophysical Research, 114, B01411. Updates at: http://topex.ucsd.edu/WWW_html/mar_grav.html
Torsvik, T.H., Amundsen, H., Hartz, E.H., Corfu, F., Kusznir, N.J., Gaina, C., Doubrovine, P.V., Steinberger, B., Ashwal, L.D. & Jamtveit, B. (2013) A Precambrian microcontinent in the Indian Ocean, Nature Geoscience, 6, 223-227.
Alvey, A., Roberts, A., & Kusznir, N., What is the thickness of Earth’s crust?
Geoscientist 28 (7), 10-15, 2018;
https://doi.org/10.1144/geosci2018-003