Product has been added to the basket
Articles

Bruce Yardley appointed Chief Geologist

Bruce Yardley (Leeds University) has been appointed Chief Geologist by The Radioactive Waste Management Directorate (RWMD) of the Nuclear Decommissioning Authority (NDA).

Chartership news

Chartership Officer Bill Gaskarth reports on a projected new logo for use by CGeols, advice on applications and company training schemes

Climate Change Statement Addendum

The Society has published an addendum to 'Climate Change: Evidence from the Geological Record' (November 2010) taking account of new research

Cracking up in Lincolnshire

Oliver Pritchard, Stephen Hallett, and Timothy Farewell consider the role of soil science in maintaining the British 'evolved road'

Critical metals

Kathryn Goodenough* on a Society-sponsored hunt for the rare metals that underpin new technologies

Déja vu all over again

As Nina Morgan Discovers, the debate over HS2 is nothing new...

Done proud

Ted Nield hails the new refurbished Council Room as evidence that the Society is growing up

Earth Science Week 2014

Fellows - renew, vote for Council, and volunteer for Earth Science Week 2014!  Also - who is honoured in the Society's Awards and Medals 2014.

Fookes celebrated

Peter Fookes (Imperial College, London) celebrated at Society event in honour of Engineering Group Working Parties and their reports

Geology - poor relation?

When are University Earth Science departments going to shed their outmoded obsession with maths, physics and chemistry?

Nancy Tupholme

Nancy Tupholme, Librarian of the Society and the Royal Society, has died, reports Wendy Cawthorne.

Power, splendour and high camp

Ted Nield reviews the refurbishment of the Council Room, Burlington House

The Sir Archibald Geikie Archive at Haslemere Educational Museum

You can help the Haslemere Educational Museum to identify subjects in Sir Archibald Geikie's amazing field notebook sketches, writes John Betterton.

Top bananas

Who are the top 100 UK practising scientists?  The Science Council knows...

Christchurch Quakes

Twenty-one months, four earthquakes, 10,510 aftershocks later*, Camilla Gibbons** describes their effect on the city and her work on rockfall remediation.

Geoscientist 22.08 September 2012

Fig 6Before September 2010, if you asked any New Zealander where the next big earthquake would be, the answer would have been "Wellington". ‘Auckland’ would have been the answer for the next volcanic eruptions and of the country’s three main cities, Christchurch would have been considered the safest as far as natural disasters were concerned. However Mother Nature has done her best to kick us out of such complacency; and after four major earthquakes and over nine thousand aftershocks (33 greater than magnitude 5.0) one wonders, when will it stop?

New Zealand is located on the ‘Pacific Ring of Fire’ at the boundary of the Pacific and Australian plates. The Pacific Plate is being subducted below the Australian Plate to the north of New Zealand and under the eastern North Island. The reverse occurs off the west coast in the South of the South Island, where the Australian plate is being subducted below the Pacific Plate. In between lies a large region of strike-slip faulting, including the 600km-long Alpine Fault (dextral strike-slip), which runs up the western side of South Island and moves on average 30m/1000 years. The Alpine Fault was expected to be the culprit in the next ‘big one’.

Caption: Boulders blocking the main surface route from the Port to the City (the other route relies on a tunnel under the hills which was closed for several days). Note the bounce marks in the tarmac.


Fig 1

ROCKFALL


Christchurch city itself is built on the Canterbury Plains, 8000 square kilometres of glacio-fluvial gravels overlain with deep alluvial deposits, laid down over the last three million years. The basal greywacke bedrock lies several hundred metres below surface. The southern part of the city lies on the eroded flanks of the extinct Lyttelton Volcano. The hills consist of interbedded dark grey basalt, often with columnar jointing; red/brown ash-dominated layers, and layers of breccia and agglomerate. The columnar basalt is very strong, the ash very weak, the breccia layers variable, and the overall rock mass dilated. With this structure and several unexpected, very large earthquakes, rockfalls were both unpredicted and abundant.

Caption: Plate tectonics map of New Zealand (Adapted from
http://data.gns.cri.nz/geoatlas/text.jsp  )

At 04:35 on 4 September 2010, a magnitude 7.1 earthquake hit Darfield, 40km west of Christchurch. I had never felt an earthquake before, and when I moved to New Zealand in early 2008, I wanted to – as long as it was a little one, and not a 7.1! I immediately thought to blame the Alpine Fault, as many did; however, the epicentre actually occurred on the previously unknown Darfield Fault, c. 40km west of the city. This quake measured 9 on the Modified Mercalli Scale (‘considerable damage’) and had a peak ground acceleration (PGA) of 1.26g. Several buildings were damaged from the shaking and large areas in the northeast of the city were covered in a thick layer of silt from the abundant liquefaction.

Life changed in an instant. It became unusual not to be woken up in the night, as the aftershocks were very regular. As many as 4428 aftershocks occurred in the following five months, 13 of which were of magnitude 5.0 or higher. Reports soon after suggested that the expected decline in the number of quakes was not happening because the Darfield fault had not ruptured in the last 16,000 years (minimum estimate) and it would therefore take a long time for the stresses to re-equilibrate. Little did we know that this was just the beginning.


Fig 4

CANCELLED


At 12:51 on 22 February 2011 I was running a bit late, heading to a seminar entitled “seismic strengthening of building foundations”. The course was eventually cancelled by the next major earthquake to hit Christchurch, this time a 6.3, centered under the south of the city, with a PGA of 2.2. Again, my immediate thought was ‘Alpine Fault’ as this one seemed much more violent than September’s quake. There was no warning rumble as there so often is (the rumble being the audible vibrations associated with the primary-waves). I was walking along the street one minute and the next I was clinging on to the two strangers as we all tried desperately to stay standing.

Caption: Cracking across the road marking the scarp of a 1.3ha landslip. Cracking extends approximately 200m to each side of the photograph

I remember looking down at the ground, where I was standing on the tram tracks, and under my feet inch-wide cracks were opening in the pavement, and the tracks buckling up out of the ground. The shaking lasted for a few seconds but it seemed an eternity. I watched a large part of the cathedral fall in the first aftershock at 13:04, before the Central Business District (CBD) was evacuated. It remains so as I write this, a year later in February 2012.

A state of emergency was declared as hundreds of buildings collapsed, 181 people were killed and many injured. Urban Search and Rescue (USAR) teams, Civil Defense personnel, army troops and an endless stream of contractors with diggers, surveyors and engineers flooded into the city to start the rescue and then recovery phases. The state of emergency lasted until April when control was handed back to the City Council.

I walked home to find my house still standing, which was a relief.  We had no water or power for a couple of weeks and portaloos on every street corner would become a normal sight for residents over the next few months as the sewer lines were also badly damaged.


Fig 2 terrain map
Caption
: Terrain map of the Canterbury and Banks Peninsula area showing the position of Christchurch on the flat plains and the flanks of the Lyttelton Volcano bordering the south of the city. Map courtesy of Google Maps - ©2012 Google

BOULDERS

The day after (23 February) I was contacted by USAR to help with geotechnical assessments and inspections. Initially I was responsible for monitoring a large landslide of approximately 1.3ha, where 500mm-wide cracks had opened up, marking the potential scarp of a large slip threatening the main road that provided the only access to hundreds of houses. This kept me busy for a few days until we had established that it was not creeping and therefore not at a high risk of imminent failure. The monitoring continued and we have since observed that movement is only activated in large seismic events.

A huge number of rockfalls from multiple exposed bluffs tumbled down the hillsides of the Port Hills to the south of the city. Cliffs had collapsed, and outcrops had shed boulders. Roads were blocked by rockfall and many houses had been hit. The initial response by USAR teams had been to evacuate people from houses at imminent risk. Following on from this, over the following months we were able to identify the rockfall source areas and in many cases found further houses at risk requiring the residents to be evacuated.


Fig 5

RESPONSE

Assessing the geotechnical damage and prioritising the emergency work was a huge task. Geotechnical engineers and engineering geologists in the city met every morning before heading out into the field in order to coordinate the day’s work. Quickly, an overview of the damage was obtained and we discovered the huge extent over which the rockfall had occurred. The volume was unprecedented because the ‘design earthquake’ only had a PGA of nearer 0.3g. The February earthquake had a horizontal PGA of 2.2, over twice the force of gravity and around five or six times larger than expected. Consequently, structures had not been designed for such huge shaking; rockfall bunds were filled and overtopped, catch-fences were at worst flattened, at best badly damaged - though many did stop some boulders.

Caption: Boulder inundation to the rear of a property


In the months after February, the Port Hills area was divided up and sections assigned to various consulting engineers. Initially we undertook a thorough inspection of the sections. Teams of engineering geologists covered the Port Hills area equipped with cameras, measuring tapes, tablet PCs - and quick wits. Tablet PCs were found to be invaluable as the boulders could be mapped and their various details entered digitally, with accurate GPS locations (obtained via 3G as well as GPS) and the data uploaded in real-time to the main GIS server. In total 10,000 boulders have now been mapped over the Port Hills area.

In one instance I counted 45 boulders in the garden of a 43m-wide property; another six had gone through the back wall into the rear rooms. In other places boulders had entered through the first floor wall of a house built into the hillside, through the internal floor, out the front wall and ended up wedged into the neighboring house below. Another landed in someone’s bed. Boulders ranged from fist-sized cobbles to large boulders of c. 35 tonnes, although the mean size was around 0.7m3 – or c. 1.75 tonnes.


Fig 11

REMEDIATION


Many boulders we mapped presented an imminent risk to roads or houses below. Work progressed on prioritising the infrastructural ‘lifelines’ (main roads, pipelines, substations etc). With the lifeline routes secured albeit temporarily, work could then commence above residential areas to try to get people back home again.

Caption : Temporary bolts cables and mesh to retain loose boulders

The boulders were stabilised in a variety of ways - from the ideal method of scaling (where safe) using a crow-bar to lever the rocks off and rolling them down. This method was ideal above roads where temporary closures could be implemented and large areas of the hillsides secured quickly. If the boulders were too big to scale, they were blasted into smaller pieces and either scaled or distributed across the slope in stable locations, ie tabular rocks laid onto their flat axis. Where blasting was not feasible, unstable areas were bolted and tied back. These are temporary works and will have to be re-visited in the long term to increase the robustness of the measures. By June 2011, the remediation of some areas were nearing completion. Unfortunately Mother Nature had another little trick up her sleeve.


Fig 12 March

HERE WE GO AGAIN

On 13 June at 1300, a magnitude 5.5 struck. The shaking was significant enough for a few things to fall over in the office and for us to head out and do a quick check on the main lifelines - where nothing too major seemed to have occurred, other than a large tension crack in the cliff above the main road. I had just arranged to get half the road closed and the traffic clear before 1400 when a magnitude 6.3 struck, this time with a PGA of 2.13g. This time the epicentre was located on the coast to the east of the city, just a few meters from where I was standing, at the base of a 75m high cliff. A huge collapse occurred, as several thousand cubic metres of rock - 15 horizontal metres of the cliff top - fell down, together with half a house. That was the fastest I ever expect to have to run, in my life.

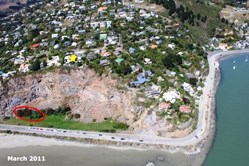
Caption : Peacock’s Gallop Cliff after the February and June earthquakes - before & after (second image below)

Hearts across the city sank as a combined groan of "here we go again" went up. Our daily geotechnical morning meetings recommenced (we had dropped them back to twice a week) and we had to re-inspect the whole of the Port Hills area again.

From a rockfall perspective, the June earthquake was more damaging than the February one in the eastern part of the Port Hills. Tens more houses had to be evacuated due to new cracking, generally at cliff-top settings. More rockfall was observed, and some boulders that had not moved previously were now at a high risk of imminent failure. The landslide that I had initially monitored in February moved another 500mm or so, and new cracking opened in new areas leading to a growing concern of new landslides developing.

The June earthquake set us back a long way in our attempts to remediate rockfall in the hills. Following the earthquake all boulders across the hills were re-mapped and evaluated. In some areas where remediation had been completed no further rockfall was observed. This was some much-needed morale-boosting news! Rockfall that did occur was, in places, very directional - in that the June fault-line was oriented approximately north-south. In one valley close to the epicentre, there was very little new rockfall on north-western slopes but over 200 additional boulders on eastern slopes. The predominant shaking was northwards; so on the north-western slopes, boulders were ‘pushed’ into the hillside while on the south-eastern slopes they were ‘pushed’ out.

Fig 12

AFTERSHOCKS


In the six months from June to December we experienced only six aftershocks greater than magnitude 5.0, and things calmed down quite quickly. Following the June quake, we started to use ballasted shipping containers as a quick solution to protect roads from rockfall. They have been extensively used in the CBD to provide protection from unstable buildings. As a rockfall measure, they have also proved very effective.

Twenty-eleven had been a hectic year and we were all looking forward to a well-earned break over Christmas. The office end-of-year barbecue was in full swing on the last Friday before Christmas when it was disrupted by yet another earthquake, this time a magnitude 5.8. I could see the surface waves travelling through the office car park as the whole ground surface took on a movement akin to sea swell. The engineering geologists and structural engineers immediately donned high-viz jackets and boots, turned on flashing lights and headed off to yet again check on the state of the main lifelines.

Half way through inspections, we experienced a magnitude 6.0 with a PGA of 1.0g. This quake was centered on another new fault, this time offshore. Large dust clouds were produced as the cliffs yet again failed. Since then, as of 21 February we have had 654 aftershocks, six of which have had magnitudes greater than 5.0. We were back into a phase of re-assessment of the whole area; however there was little damage in new areas and the temporary works in place were unaffected. The shipping containers retained the debris from the new cliff collapses and new boulders generally fell in high-risk areas already evacuated or cordoned-off. The system is therefore working.

Rockfall is just one effect of the earthquakes. There has also been significant liquefaction with each new aftershock, and several thousand tonnes of silt have been removed from the city. Vast areas of residential land have been written off, while whole suburbs having to relocate. A huge percentage of buildings in the CBD are currently being demolished.

Who knows what is in store for Christchurch? We can only guess but I hope that this is the end of the story - and that I will not be writing ‘part two’ in another year’s time.

Further readingCamilla Gibbons

  *As of 4th July 2012

** Camilla Gibbons is a Senior Engineering Geologist with Aurecon New Zealand Ltd., living and working in Christchurch. She was made ‘New Zealand Young Engineer of the Year’ in 2011 (picture).