Helen Burke*, Rolf Farrell§ & David Morgan* on how 3D geological models help flood risk management in E Yorkshire
Flooding hit the headlines throughout the winter of 2013-14, with significant lowland areas of the UK (the Somerset Levels, Thames Valley and parts of southwest England) affected by coastal or inland (river or groundwater) flooding. The flooding was caused by a succession of Atlantic depressions and storm tracks that raced towards northern Europe, bringing high winds and above-average rainfall.
In early December 2013 these combined with high tides to create a tidal surge that affected low-lying coastal areas adjacent to the Irish and North Seas. Throughout the winter, flood damage to property, businesses and infrastructure was extensive and the overall cost to the UK economy was at least £1.1bn, taking into account insurance claims, uninsured losses, costs to Government and businesses1. The impact of these storms and floods highlights the vulnerability of certain parts of the UK to the forces of nature, with flooding likely to become more commonplace in the future if climate predictions for increased storminess and intensity prove correct2.
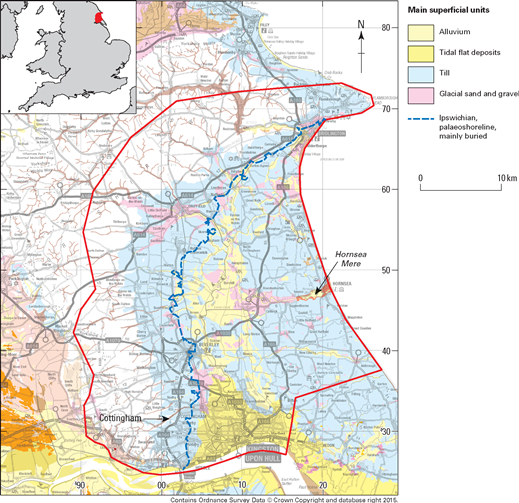 Figure 1:1:50,000 scale superficial geology map of the Holderness 3D geological model area (red), which covers 1280km2, from Kingston-upon-Hull to Flamborough Head and from Market Weighton to the east Yorkshire coast. Area underlain by thick glacial deposits, including till (pale blue) and glacial sand and gravel (pink).
Holocene sediments: tidal flat deposits along the Humber Estuary, beneath Kingston-upon-Hull, and alluvium along river courses (yellow). Ipswichian palaeo-shoreline (blue), runs north from Hessle on the Humber Estuary, arcs eastwards to coast at Sewerby. White indicates superficial deposits absent. Contains Ordnance Survey data © Crown Copyright and database rights 2015. Contains DiGMap-GB geology data BGS©NERC. All Rights Reserved 2015.
Eastern England
Low-lying areas of eastern England, including the Humber Estuary and adjacent areas around Beverley, have historically been particularly susceptible to flooding. Kingston-upon-Hull lies in the south of the River Hull catchment, which covers an area of around 980km2, including the Yorkshire Wolds and the Humber Estuary.
The River Hull catchment area is very low-lying and carries the second greatest flood risk in England, exceeded only by the River Thames. Approximately 100,000 properties and over 5000 hectares of agricultural land within the catchment are at risk from river flooding. Within the Kingston-upon-Hull city boundary alone, more than 130,000 properties are at risk from all sources of flooding.
Historical records dating back to the 17th Century document flooding in Kingston-upon-Hull, including the catastrophic tidal surge of 1657, which inundated the area with over one and a half metres of water. Prolonged rainfall in November 2000 caused severe surface flooding when the River Hull burst its banks and drains were unable to cope with the additional volume. Another severe flood event occurred in December 2013, when Kingston-upon-Hull was inundated by sea water. The highest ever tide was recorded at the River Hull Tidal Surge Barrier that day, and coastal defences were overtopped. This event was caused by a tidal surge that coincided with a spring tide.3
Among the Environment Agency’s responsibilities is the management of water quality and resources and the management of flood risk from major rivers, estuaries and the sea. Its responsibilities include installing and maintaining flood defences, monitoring river levels and managing the Chalk Group groundwater aquifer - a principal water source for much of eastern England, but also a potential source of groundwater flooding. In partnership with the Environment Agency, local authorities are currently drafting plans to reduce flood risk and limit its impact over the next 50-100 years.
3D needs
The Environment Agency requires a three-dimensional (3D) understanding of the geology of the area and its influence on the movement of groundwater through the shallow subsurface. To meet this requirement, the British Geological Survey (BGS), working with the Environment Agency, constructed a detailed 3D geological model of the Holderness area. The model establishes the subsurface geometry of the Quaternary succession and identifies permeable groundwater pathways connecting the Chalk aquifer to parts of the superficial sequence and, potentially, the ground surface. This helps the Environment Agency to manage water resources effectively and advise on locating flood defences.
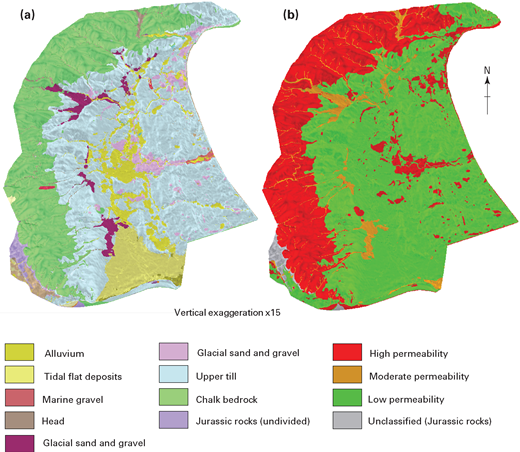
Figure 2: The Holderness 3D model is attributed with stratigraphy or permeability. (a) 3D view of the Holderness model coloured by stratigraphy; (b) 3D view of the model attributed by the bulk permeability value assigned to each unit. Chalk and sand and gravel have been attributed as high permeability; units with high proportions of clay, e.g. till, classed as low permeability. Purple glacial sand and gravel unit contains clay and has been attributed as moderate permeability.
So how did we build the model? The Holderness 3D geological model was created using a specialist 3D modelling package called ‘Geological Surveying and Investigation in 3D’ (GSI3D). This considers a variety of geological data types4. The ingredients included 1245 borehole records from archives at the BGS and the Environment Agency, surface geological map data (BGS DiGMAPGB-505), a Digital Elevation Model (DEM) which accurately depicts the ground surface, published literature, and a small team of enthusiastic geologists6.
The 3D model shows that most of the Holderness model area is covered by superficial deposits, underlain by Chalk bedrock with its top surface (rockhead) forming a slope that dips gently eastwards at 1-2°. This slope is not smooth, but undulates in places with several buried valleys incised into it.
In addition, an ancient Ipswichian shoreline, aged approximately 121ka7, forms a small step-feature in the Chalk surface. This palaeo-shoreline is mostly buried beneath superficial deposits, but crops out on the coast at Sewerby and Hessle.
Glacial
The overlying Quaternary succession is dominated by glacial sediments, including tills, sands and gravels, silts and clays, which reach c. 50m thickness in some areas. These glacial sediments were laid down during the latter part of the Late Devensian (c.27 to 15ka8), the last major glaciation to affect the British Isles during the Quaternary. At this time much of northern Britain was covered by up to 1.6km of ice of the British-Irish Ice Sheet9.
The North Sea Ice Lobe of the British-Irish Ice Sheet extended down the North Sea coast of Britain as far south as northern Norfolk. The North Sea Ice Lobe was one of several fast-flowing rivers of ice, called ice streams, that rapidly drained ice from the interior of the ice sheet outwards towards its margins. This overtopped Flamborough Head, occupying the lowland area of East Yorkshire inland as far west as the Chalk escarpment.
Several major oscillations of the ice margin produced the classic till sequences of the region10,11,12 that include distinctive erratics derived from northern Britain and Scandinavia 13,14. At this time a second, small ice-stream occupied the Vale of York to the west of the Chalk escarpment. Floodplain alluvium and tidal flat deposits, mainly composed of silts and clays, overlie the glacial sequence. These are locally incised into the glacial sequence and make up most of the Holocene sediments in the region. The extent of the glacial sediments and Holocene deposits can be seen in the Quaternary geological map of the region. <Fig. 1>
The wide range of lithologies in the Quaternary sediments gives rise to highly variable porosity and permeability properties, which in turn affect the storage and flow of groundwater, including, where connected, transmissivity into the underlying Chalk aquifer.
Model applications
As highlighted earlier, East Yorkshire has a history of flooding from several different sources. Low-lying coastal areas are susceptible to tidal flooding, particularly when high tides coincide with strong winds to produce storm surges, raising the level of the sea and enabling sea water to inundate the land.
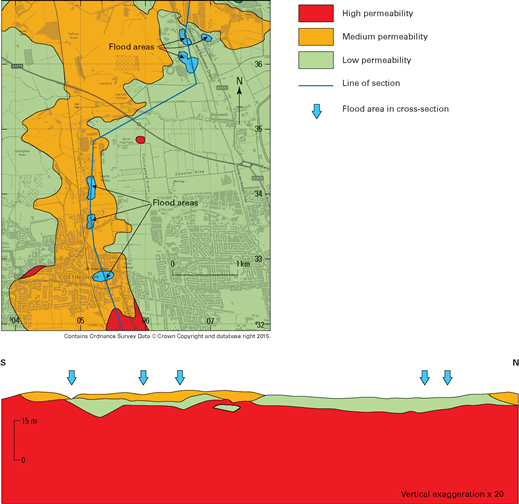 Figure 3: Location map of groundwater flooding recorded in Cottingham, 2001 (flooded areas shown) and a cross-section from the Holderness model. By colouring with the permeability attribute, the EA could distinguish between areas affected by surface flooding and areas of groundwater flooding. Flooding in the northern limb of the cross-section was caused by an abstraction borehole. Contains Ordnance Survey data © Crown Copyright and database rights 2015.
River flooding occurs when the volume of water being carried by a river exceeds the channel capacity. This commonly occurs after prolonged heavy rain, whereby the river bursts its banks to flood adjacent low-lying areas.
Groundwater flooding occurs when the water table rises and intersects the ground surface in response to heavy rain. Kingston-upon-Hull is particularly susceptible to all of these types of flooding because of its location in a floodplain area, its proximity to a low lying coastal region and the presence of relatively shallow groundwater aquifers.
The Holderness 3D geological model helps the Environment Agency determine whether there is a geological control on groundwater flooding in the region, such as aquifers within the superficial deposits and hydraulic pathways from the Chalk aquifer to the ground surface. The Agency’s initial understanding of the regional geology was based mainly on traditional published geological maps of the area, which indicate that the Chalk is overlain by a fairly substantial thickness (up to 50m) of mostly low-permeability glacial till with highly permeable bodies of sand and gravel occurring locally.
However, prior to our 3D modelling, their geometries, extents and connectivity remained poorly understood. With the Holderness 3D geological model, the distribution of highly permeable rocks and sediments at depth and in the shallow sub-surface can easily be visualised and analysed.
Lithology
Each geological unit in the Holderness model is attributed with lithology and a bulk permeability value (high, moderate and low), as shown in the figure <Fig. 2>. The Environment Agency uses the permeability information to identify areas where permeable sediments are present throughout the sequence of superficial deposits, from the ground surface to the top of the Chalk. These areas are of particular interest because they may indicate where groundwater flooding is most likely.
One test location is Cottingham, a low-lying town just outside Kingston-upon-Hull. Back in 2001, flooded excavations were reported in the area, although the cause, source and potential for groundwater flooding at the time were unknown. Cottingham is located in an area that was once marshland and is drained by an artificial drainage network that pumps water into the River Hull. The land in this area is situated below mean high tide level and was prone to river flooding.
To reduce this risk, the River Hull has been artificially raised above the land surrounding it. The water table in the Cottingham area has a very shallow slope angle, or low hydraulic gradient, which inhibits drainage at the ground surface. It is therefore difficult to tell whether flood events are caused by groundwater or surface flooding because surface floodwater can take a long time to dissipate.
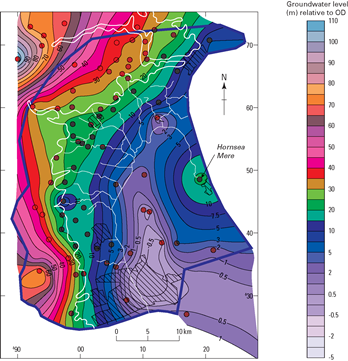
Figure 4: Contour plot of groundwater levels in the Chalk aquifer in East Yorkshire14. Note the ‘bullseye’ of much higher readings at Hornsea Mere, approximately half way up the east coast.
To investigate the cause of flooding at Cottingham the Environment Agency constructed a cross-section in the Holderness model through the areas where flooding had occurred in 2001 and coloured the model according to the permeability attribute – see diagram. <Fig. 3> This revealed that flooded areas underlain by low permeability superficial deposits are most likely to have been affected by surface water flooding, and groundwater flooding is likely to have occurred where permeable or moderately permeable superficial deposits connect the Chalk aquifer to the ground surface.
However, not all flooding in the area is natural. The northern limb of the cross-section passes through a cluster of flooded areas to the north of Cottingham, where the Chalk aquifer is overlain by approximately 10m of low permeability Quaternary sediments. After further investigation the Environment Agency discovered that the cause of this flooding is most likely to be an abstraction borehole and historic site-investigation boreholes, which have created artificial hydraulic pathways through the relatively impermeable superficial deposits into the underlying Chalk aquifer, enabling groundwater within the Chalk to rise up and flood several fields.
Vulnerable
Using the Holderness model, the Environment Agency discovered where the Chalk aquifer is most vulnerable to pollution from contaminants derived from historic land use. To manage water resources in the Cottingham area more effectively, the Environment Agency needed to understand the complexity of the superficial deposits. The Chalk aquifer is particularly vulnerable to pollution in areas where superficial deposits are very thin or completely absent and where permeable superficial deposits form a hydraulic pathway through the Quaternary to the surface. Disused gravel pits in the Cottingham area that were long ago used as waste-disposal sites are of particular concern to the Environment Agency because the landfill material is permeable and could contain contaminants, which might leak into the Chalk aquifer. This is especially important at Cottingham because two public water-supply boreholes are located in the area.
The Environment Agency used the geological detail in the Holderness 3D model to control development within the Source Protection Zone at Cottingham, which directly affected local planning applications. This is one of over 2000 Source Protection Zones in England and Wales established by the Agency to protect groundwater sources of public drinking water. Strict planning controls ensure that new developments posing a contamination risk are not located close to Source Protection Zones. One such development type is the installation of new petrol stations and associated underground fuel storage tanks.
The Cottingham Source Protection Zone is centred on public water supply boreholes and was originally established using a numerical model of groundwater movement. However, this numerical model did not take into account the Quaternary sediments that overlie the Chalk aquifer. Using the geological detail in the Holderness model the Environment Agency have recently updated the Cottingham Source Protection Zone. This has directly influenced local planning policy, with land previously allocated for housing developments now falling within the most sensitive part of the Groundwater Protection Zone, where housing developments are not normally permitted. The Holderness model enabled the Environment Agency to consider the local geology when making decisions on planning applications within the Cottingham Source Protection Zone. Only areas where the Chalk is overlain by a thick layer of clay were considered suitable for housing developments because the risk of contaminating the Chalk aquifer there is relatively low.
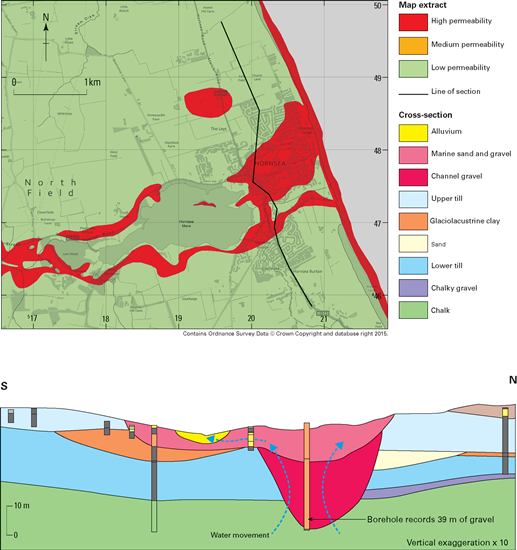
Figure 5: Location map of Hornsea Mere cross-section, showing permeability values (high, moderate, low). The cross-section through Hornsea shows a gravel-filled channel cutting the surrounding clay-rich glacial deposits and into the Chalk. This permeable gravel unit enables the water table to rise through the superficial deposits and supply Hornsea Mere.
The Holderness geological model has also enabled the Agency to revise its hydrological understanding of the Chalk in East Yorkshire and validate their groundwater levels data. One location of particular interest is Hornsea Mere, where groundwater level is unusually high in one monitoring borehole <Fig. 4> - c. 10m higher than the surrounding area12. There was an obvious need to find out if this local anomaly was geologically controlled. Superficial deposits are at their thickest along the East coast, and are typically of till, with a high proportion of clay and should, in theory, act as a seal, trapping groundwater within the Chalk.
The 3D model revealed that the groundwater monitoring borehole is located in a deep gravel-filled channel that cuts through the glacial sediments directly into the Chalk aquifer <Fig. 5>. This provides a direct pathway from the aquifer through the superficial deposits, enabling groundwater-fed recharge of Hornsea Mere. The area where connectivity between the channel and the Chalk aquifer occurs is actually relatively small, and would have been difficult to predict without the Holderness 3D model. However, further investigation will be needed to find out exactly why the groundwater level within the Chalk is higher in this area.
Conclusion
Flooding is a major economic and societal issue, and is expected to become more frequent. One area with a long history of flood events is Kingston-upon-Hull because of its low lying coastal location within a floodplain. Groundwater flooding is difficult to predict and model, making groundwater flood mitigation especially difficult. The Holderness model provides a means for Environment Agency to distinguish between groundwater and surface flooding, which helps them determine which mitigation measures are most suitable.
The Holderness geological model has been used by the Environment Agency to revise the Source Protection Zone located at Cottingham, where strict development controls protect supplies of public drinking water. This revision has directly influenced local planning policy, with the Environment Agency ensuring that the Chalk aquifer is covered by a thick layer of clay beneath land allocated for housing developments in the area.
Three-dimensional geological models are useful tool for visualising the geology and can be used to identify areas of connectivity between permeable and non-permeable units and the underlying bedrock. The Environment Agency have used the 3D geological model of Holderness to increase their understanding of the geology and hydrogeology, which helps them to manage water resources more effectively and mitigate the risks associated with flooding.
The Holderness model has contributed to BGS’s National Geological Model15, which comprises over 150 geological models of various scales and levels of detail. Models such as these will continue to add to the BGS’s understanding of the 3D geology of the UK.
The Holderness model is attributed with permeability values to meet the Environment Agency’s needs, but any number of additional attributes could be assigned to the modelled geological units, including engineering properties, such as strength and porosity.
Acknowledgements
The authors wish to thank Jonathan Lee, Steve Mathers and Jon Ford (BGS) for their constructive comments, and the Environment Agency for commissioning the Holderness model and providing valuable feedback on its application. The authors also wish to thank Mahmoud Hussein for giving his permission to publish groundwater data from his PhD thesis.
References
- Shrubsole, G. 2014. Counting the £1bn cost of the winter floods. New Statesman magazine, June 2014
- Environment Agency, 2010. Hull and Coastal Streams: Catchment flood management plan. Summary report, December 2010. Environment Agency
- Anon, 2014. Hull City Council Flood Investigation Report: December 2013 City Centre Tidal Surge Flood Event
- Kessler, H., Mathers, S.J. & H.-G. Sobisch. 2009. The capture and dissemination of integrated 3D geospatial knowledge at the British Geological Survey using GSI3D software and methodology. Computers & Geosciences, 35, pp 1311–1321 http://dx.doi.org/10.1016/j.cageo.2008.04.005
- BGS DiGMapGB-50. 1:50,000 scale digital geological map data http://www.bgs.ac.uk/products/digitalmaps/digmapgb_50.html
- Burke, H. F., Morgan, D. J. R., Kessler, H. and Cooper, A. H., 2010. A 3D geological model of the superficial deposits of the Holderness area. BGS Commissioned Report no. CR/09/132N (open access). http://nora.nerc.ac.uk/16850/
- Bateman, M. D. And Catt, J. A., 1995. An absolute chronology for the raised beach and associated deposits at Sewerby, East Yorkshire, England. Journal of Quaternary Science 11, pp 389-395
- Clark, C. D., Hughes, A. L. C., Greenwood, S. L., Jordan, C. and Sejrup, H. P., 2012. Pattern and timing of retreat of the last British-Irish Ice Sheet
- Smith, D. E., and Harrison, S. 2008. The Last glacial Maximum British-Irish ice sheet: a reconstruction using digital terrain mapping. Journal of Quaternary Science 23 pp 241-248.
- Evans, D. J. A. and Thompson, S. A., 2010. Glacial sediments and landforms of Holderness, eastern England: A glacial depositional model for the North Sea Lobe of the British-Irish Ice Sheet. Earth Science Reviews 101 pp 147-189
- Catt, J. A., 2007. The Pleistocene glaciations of eastern Yorkshire: a review. Proceedings of the Yorkshire Geological Society Vol. 56, pp 177-207
- Madgett, P. A. and Catt, J. A., 1978. Petrography, stratigraphy and weathering of late Pleistocene tills in East Yorkshire, Lincolnshire and north Norfolk. Proceedings of the Yorkshire Geological Society 42 part 1, pp 55-108.
- Busfield, M. E., Lee, J. R, Riding, J. B., Zalasiewicz, J. and Lee, S. V., 2015. Proceedings of the Geologists’ Association 125 pp 86-99.
- Hussein, M. E. A., 2012. Borehole water level response to barometric pressure as an indicator of groundwater vulnerability. PhD thesis, School of Earth and Environment, University of Leeds, UK.
- BGS web pages on the National Geological Model http://www.bgs.ac.uk/research/ukgeology/nationalGeologicalModel/home.html
Authors
* British Geological Survey; § Environment Agency. Helen Burke and David Morgan publish with the permission of the Executive Director, British Geological Survey, Natural Environment Research Council.