Kristin Vala Ragnarsdottir and the ASAP team* explore the hidden links between geology, economics and well-being
When it was conceived, Gross Domestic Product (‘GDP’) was a useful signpost on the path to a better world. Increased economic activity meant jobs, income, and basic amenities to reduce worldwide social conflict and prevent a third world war. But now, economic activity has created a world very different from the one faced by global leaders at their 1944 Bretton Woods, New Hampshire, meeting to design the post-war global economic order. We live in a world overflowing with people and man-made capital, where emphasis on growing GDP, consumption and economic activity is leading the world towards increasing instability, natural resource depletion and environmental degradation, while developing nations still need to lift people from poverty.
As John Kenneth Galbraith once observed: ‘to furnish a barren room is one thing. To continue to crowd in furniture until the foundation buckles is quite another’
1. More than 150 years ago, John Stuart Mill noted that, once assured decent living standards, human efforts should be directed to mental culture, the pursuit of social and moral progress, and the increase of leisure, rather than a never-ending struggle for material wealth and status
2,3.
GDP basis
Societal goods need natural resources that are converted through work and energy. The underlying basis of Gross Domestic Product (GDP) is the market value of all officially recognized final goods and services produced within a country in a year. ‘GDP per capita’ is often considered an indicator of a country´s standard of living. GDP, however, does not directly measure societal well-being or happiness, as numerous authors have shown. Research shows that while money does buy well-being for the poor, and wealthier individuals are on average happier than poorer ones, above a certain income level more money does not make people any happier
4.
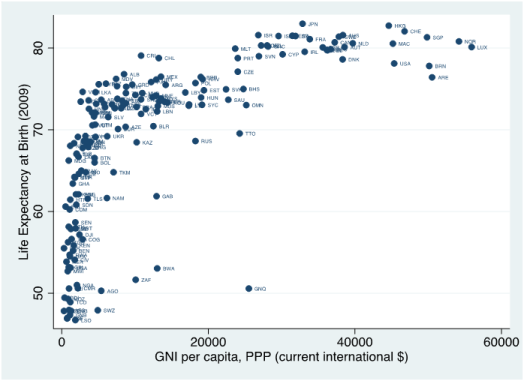
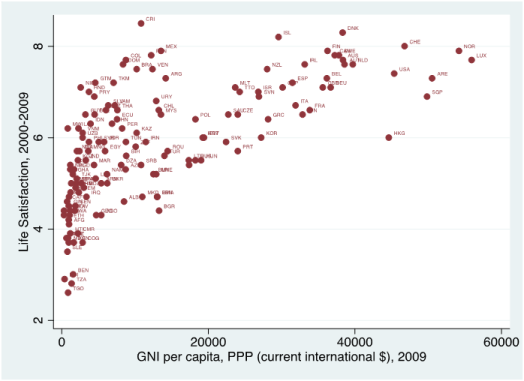
Nations with a higher gross national income (GNI) enjoy, on average, better health (longer life expectancy) and wellbeing (higher life satisfaction) than poorer ones (Figure 1a, right, and 1b below), but after a certain threshold of per capita income, more wealth does not necessarily make them healthier and happier. Although wealth is necessary for reducing human misery, it is only valuable up to a certain point. Thereafter it does not generate further improvements either in health conditions or quality of life.
Caption to figures 1a,b:
Gross National Income per capita and Life Satisfaction in 148 Nations, 200-2009 (a) and Life Expectancy at Birth in 175 Nations, 2009 (b). After46.
Significant research on alternative indicators continues. We, at the Alliance for Sustainability and Prosperity, believe it is time to build the consensus necessary to move beyond GDP towards better measures of sustainable and equitable prosperity of people and their well-being.
Natural resources and GDP
Natural resources provide raw materials for conversion through work and energy into goods that have higher value than those raw materials. They form the basis for GDP growth, and this is where geologists come in. They know where, and how, Earth resources have been formed, can quantify reserves and predict how long they will last.
Oil geologist King Hubbert predicted in the 1950s that oil production would peak around 2000
5. Peak oil production was actually achieved in 2006
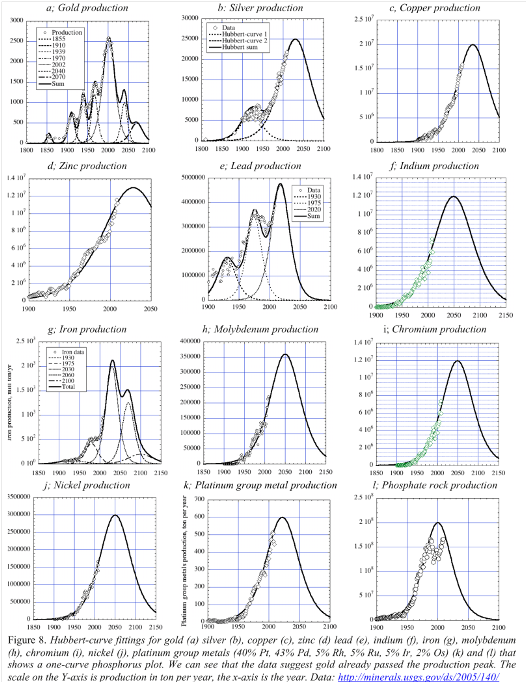
6. More recently, my co-workers and I have shown peak production curves for dozens of natural resources
7,8,9,10 (see Figure 2, above). The production of nearly all of these has either peaked already or will peak before 2050. This has serious consequences for technology development this Century. This historical research has also demonstrated a link between resource discovery peak, production peak, wealth peak and when costs overrun wealth. There is a 20-40 year period between the production peak of a nation´s natural resources, and the point where the wealth of those nations starts to fall.
Governments around the globe are waking up to this world of limited resources. In using resources and transforming them into goods, capital stocks are built up that add to the wealth of present and future generations. With a global population of 7.2 billion and rising, our current resource-use means that the chances of future generations - and developing countries - to have access to their fair share of scarce resources are endangered.
Moreover, the consequences of that continued resource-use may induce serious damage, beyond the carrying capacity of the environment. These effects may be aggravated once the developing world has taken up growth and resource-use at levels similar to those of already industrialized countries
11.
As Herman Daly, former World Bank senior economist, once observed: the expectation that we can overcome the physical limits of economic growth by ‘angelizing’ the GNP is a myth (we would need to become angels before doing so, he explained)
12. It follows that the progress of nations needs new indicators, and work is needed to underpin prosperity without growth
3. It is finally becoming broadly recognized that maximizing GDP, which was never meant to measure societal well-being, is no longer an appropriate goal for national policy
13,14,15,16,17.
GDP – progress indicator
It has often been observed that if GDP goes up so do jobs, and since politicians care about jobs, GDP was deemed a proxy for well-being – a false conflation. Although no single measure will satisfy all purposes, GDP gained enormous power to influence national and international economic policy because of the broad consensus surrounding its measurement, over many years and countries
18. However, GDP only measures market transactions; conflates costs and benefits, and completely ignores distribution of income and external social and environmental costs and benefits.
If a business used GDP accounting it would try to maximize ‘gross revenue’ and ignore everything else - hardly a smart or sustainable approach. As Robert Kennedy once said: ‘[GDP] measures neither our wit nor our courage, neither our wisdom nor our learning, neither our compassion nor our devotion to our country; it measures everything, in short, except that which makes life worthwhile’
19. There is therefore a critical need for alternatives that have similarly broad consensus.
New indicators
Communities, countries, and the planet as a whole, need ways to track progress toward meeting shared goals in order to achieve them. A key prerequisite is establishing what those shared goals are20.
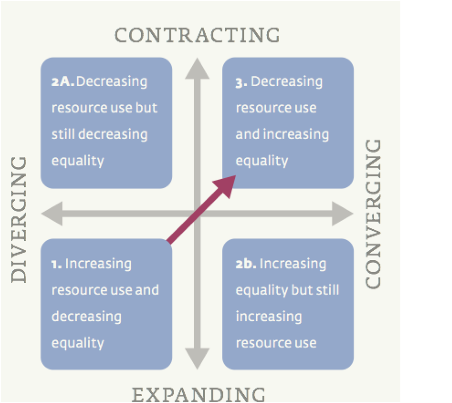
One suggested framework is that of finding steps toward equity within limits21, which shows (Figure 3, right) how the global South needs to move from the present day (increasing resource use and decreasing equality - quadrant 1) to decreasing resource use and increasing equality (quadrant 3) while supporting the global South to increase equality and resource use (quadrant 2b) on their way to quadrant 3.
Caption, Figure 2: A framework proposed for convergence. The scenario shows how the global South needs to move from quadrant 1 till 3 while allowing the global South to move via quadrant 2b. After21.
While discussion continues, broad agreement is emerging that societal goals should include a high quality of life that is equitably shared, both within and between nations, and is ecologically sustainable. GDP cannot measure progress toward this goal, since it only measures the aggregate level of marketed production and consumption - with nothing about neither non-marketed contributions to quality of life (voluntary work, bringing up children). Nor does GDP address distribution of consumption, or sustainability.
How then can we measure progress toward these broader goals? A number of alternatives have been proposed over the years (S3 – Online). These can be divided into three broad groups: (1) measures that modify economic accounts to address equity and non-market environmental and social costs/benefits; (2) measures that use weighted indices of ‘subjective’ indicators based on survey results; and (3) measures that use weighted indices of a number of ‘objective’ indicators.
Some indicator alternatives are intended as explicit alternatives to reliance on GDP that address some of its shortcomings (S3). They cover annual income, net savings, and wealth, respectively. All three elements should form part of an integrated treatment of societal well being, but here we focus on income since it is most directly comparable with GDP.
Download table of alternative indicators
The Index of Sustainable Economic Welfare (ISEW) was first developed by Herman Daly and John Cobb13 and later slightly modified and renamed the Genuine Progress Indicator (GPI)22. GPI starts with Personal Consumption Expenditures (a major GDP component) but adjusts it using 24 other components, including income distribution, environmental costs, and negative activities such as crime and pollution, among others. GPI also adds positive components that are left out of GDP, including the benefits of volunteering and household work23. By separating activities that diminish welfare from those that enhance it, GPI better approximates sustainable economic welfare24.
Inequality
It is important to note the influence of the distribution of income on well-being. It is clear that there are decreasing marginal returns to income. A pound´s worth of increased income to a poor person produces more additional well-being than a pound´s increased income to a rich person. Also, if salaries across the board go up by, say, 3% per year, then a low salary of, say, £20,000 and a high salary of £80,000 will double at the same time (23 years – 70/3) producing a low salary of £40,000 but a high salary of £160,000. That is as relevant to income differences within societies as to those between countries at different levels of development.
However, within societies inequality also has important psycho-social effects. As Plato (424-348 BC) noted: “there should exist among the citizens neither extreme poverty nor excessive wealth”
25. Since then, many others have regarded inequality as divisive and socially corrosive - as emphasized by the French Revolution. Now that we have the data to compare income distribution in different countries, Plato’s intuition turns out to be profoundly true: inequality damages the social fabric of societies, reduces trust and weakens community life
26,27,28.
But its effects on well-being go wider than that. Countries with bigger income differences between rich and poor also see greater prevalence of a wide range of health and social problems - including more violence, less good physical and mental health, more drug abuse and higher levels of imprisonment
29,30. And the fact that societies with bigger income differences also have lower social mobility means that income inequality entrenches the inequalities of opportunity facing young people
29,30,31.
While the effects which larger income differences have on rates of health and social problems are greatest among the poor, evidence suggest that few if any sections of society remain untouched by their social or economic effects.
As well as having such important effects on the well-being of populations, greater inequality poses a serious obstacle to sustainability because large income differences amplify status competition and so intensify consumerism (and hence resource use). If we are to reduce consumerism we need to reduce inequality. Lastly, more unequal societies appear to be more prone to economic instability: inequality amplifies booms and slumps in the business cycle
32.
 GDP compared
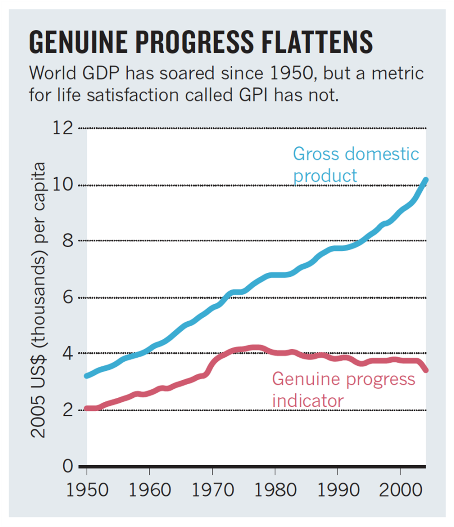
A recent study collected data from 17 countries representing 53% of the global population, for which time series of GPI had been estimated33. A global GPI/capita time series estimated from this data (Figure 4, left) shows that while GDP/capita and GPI/capita were highly correlated from 1950 to about 1978, after that point rising income inequalities - combined with increasing environmental and social costs - outweighed the benefits of rising GDP, and global GPI/capita has leveled off.
Caption, Figure 3: Gross national product and Genuine progress indicator as a function of time from 1950-2010. After33.
From 1950 to 1978 GDP/capita correlated positively with GPI/capita (R2 = 0.97); but after 1978 this correlation turned negative (R2 = 0.61). The study also collected data on several other indicators (S3, Online), including Life Satisfaction (LS) based on subjective well-being surveys, the UN Human Development Index (HDI), the Gini coefficient to estimate income distribution, and the Ecological Footprint (EF). For the 17 countries surveyed, GDP/capita was highly correlated with HDI (R2 = 0.84 p< 0.0001). This is to be expected since HDI is an index of GDP/capita along with life expectancy, and spending on health and education and all three of these variables are highly correlated with GDP/capita.
Ecological Footprint/capita was also highly correlated with GDP/capita weighted by population (R2 = 0.85, p<0.0001), since GDP is related to the consumption of the natural resources and energy included in EF. Interestingly, Life Satisfaction (LS), the only subjective well-being indicator used in this study, is not highly correlated with GDP/capita but it is highly correlated with GPI/capita weighted by population (R2 = 0.68, p<0.0001). This indicates that GPI does pick up many of the components relevant to Life Satisfaction, including fairness and social and environmental effects.
Life quality and happiness
Life Satisfaction (LS), based on surveys of subjective well-being, has been the object of much recent research
34,35,36 and has been recommended by some as the appropriate measure of societal well-being
37. However, caution is needed when comparing subjective indicators across societies and cultures. For example, individual-level self-rated health is correlated with morbidity and mortality within countries, but average levels of self-rated health in different countries are unrelated to average life expectancy
38,39 as demonstrated by Sen40 who showed that self-rated health in India was comparable with that of USA, in spite of large gaps in life expectancy between those countries.
One interesting example of a subjective well-being measure is the country of Bhutan, which has developed an index called “Gross National Happiness” (GNH). The GNH index is based on elaborate surveys of the population around nine domains: psychological well-being, standard of living, governance, health, education, community vitality, cultural diversity, time use, and ecological diversity (Table, below). However it is also clear that individuals do not always have access to full information about what contributes to their own well-being or the ability to process that information effectively41. A comprehensive picture of societal well-being and quality of life therefore needs to integrate both subjective and objective measures42.
Table caption: Known resource discovery, resource extraction and wealth creation peaks, cost over wealth overshoots and predicted civilization declines, a preliminary prognosis. Red numbers are predicted dates, black dates areobserved dates from historical data. After8.
|
Empire
|
Predicted with meta-model prototype based on the WORLD-model, outputs in calendar year
|
Observed
decline
|
|
Discovery
peak
|
Resource peak
|
Wealth peak
|
Cost > wealth
|
Predicted
decline
|
|
Roman Empire
|
14 AD
|
80-120
|
120-160
|
180-220
|
240-280
|
First 287
Final 370
|
|
British Empire
|
1888
|
1928
|
1938-1943
|
1958-1963
|
1978-1981
|
Dismantled 1947-1965
|
|
Spanish
|
1520
|
1550
|
1565
|
1580-1600
|
1620-1660
|
1700-1750
|
|
Soviet
|
1932
|
1948
|
1960
|
1985-1990
|
1995-2005
|
1990-1993
|
|
Russia
|
1880
|
1993
|
2005
|
2020-2025
|
2035-2045
|
n.a.
|
|
American
|
1955
|
1971
|
1983-1986
|
1991-2006
|
2010-2030
|
2008-2012
|
|
Chinese
|
2000
|
2020-2025
|
2035-2040
|
2050-2060
|
2060-2080
|
n.a.
|
|
Indian
|
1990
|
2030-2040
|
2045-2055
|
2068-2080
|
2077-2090
|
n.a.
|
|
Global
|
1975
|
2007
|
2017-2022
|
2040-2060
|
2060-2080
|
n.a.
|
For example, the ‘Happy Planet Index’ from the London-based New Economics Foundation multiplies LS by life expectancy and divides by EF to get both the benefits (quality life-years) and costs (resources consumed) into the index. Another approach frequently taken is to collect a range of variables thought to influence well-being (income, housing, jobs, health, civic engagement, safety, life satisfaction, etc.) and develop a weighted index of these. How one weights these variables obviously strongly influences the ranking. The OECD ‘Better Life Index’ takes an interesting approach by allowing users to put in their own weights on an interactive website and see the results immediately43. So far, this index only covers 36 OECD countries for one year.
 Way forward
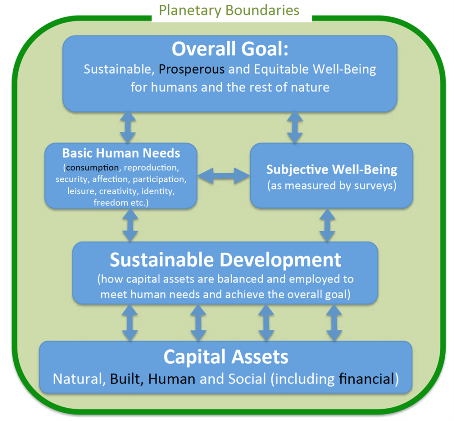
A framework for achieving the overall goal of sustainable, prosperous and equitable well-being for humans and the rest of nature is given in (Figure 5, right). Only the items in black are currently partially picked up in GDP. The time is right to embark on a new round of consensus-building that will re-invent what has been institutionalized over the past 65 years. There is wide agreement on the need for (1) new goals with a broader view of the interconnectedness among long-term, sustainable economic, social, and ecological well-being; (2) better ways to measure progress towards these goals; and (3) an invigorated campaign for the realization of this evolved economic system.
Caption, Figure 4: Relationship between the overall goal of sustainable well-being and the subjective and objective elements that contribute to it. Only the items in black are currently partially picked up in GDP. Double-headed arrows indicate that influences go in both directions and that all elements are interconnected. After17,45.
What is missing, however, is a global dialogue, akin to the original Bretton Woods meetings, in setting the goals, institutions, and measures of progress at multiple scales, from communities to states, countries, and the whole world. The critical differences would be that this new dialogue should create solutions to today’s global challenges, and bring onboard new thinking about what ‘progress’ is, and how to measure it.
A new hunt for natural resources is breaking out the world over, because those resources form the backbone of every economy
11. Geologists can aid this process by correctly mapping out natural resources and making sure that their exploitations benefit the nations where they are found – for example, by signing up to the Extractive Industries Transparency Initiative
44. The goal of a new dialogue would be broad consensus, with broad participation, high-level input, and transparent discussion and incorporation of the various complex measurement issues. It would complement the framing of new UN Sustainable Development Goals by providing consensus on measures of progress. A new Alliance for Sustainability and Prosperity (ASAP)
45 has been established to help facilitate this dialogue.
It is often said that ‘you get what you measure’. To build a sustainable and desirable future we need to measure what we want, remembering that it is better to be approximately right than precisely wrong. The role of geologists in building this future cannot be overestimated.
Authors
*Kristin Vala Ragnarsdottir
1, Robert Costanza
2, Enrico Giovannini
3, Ida Kubiszewski
2, Hunter Lovins
4, Jacqueline McGlade
5, Kate E Pickett
6, Debra Roberts
7, Roberto De Vogli
8, Richard Wilkinson
9.
- Institutes of Earth Sciences and Sustainable Development Studies, University of Iceland
- Crawford School of Public Policy, Australian National University
- Department of Economics and Finance, University of Rome “Tor Vergata”, Italy.
- President, Natural Capital Solutions, Longmont, Colorado, USA.
- University College, London and United Nations Environment Program, Nairobi, Kenya
- Department of Health Sciences, University of York, UK
- Environmental Planning and Climate Protection Department, eThekwini Municipality, Durban, South Africa
- Department of Public Health Sciences, University of California at Davis, USA
- Division of Epidemiology and Public Health, University of Nottingham, UK
References
- Galbraith, J. K. The Affluent Society (Pelican, 1996).
- Mill, J. S. Principles of Political Economy With Some of their Applications to Social Philosophy (John W. Parker and Son, 1848).
- Jackson, T. Prosperity Without Growth. Economics for a Finite Planet (Earthscan, 2009).
- Diener, E. & Suh, E. M. in Well-being: The foundations of hedonic psychology (eds Kahneman, D., Diener, E. & Schwarz, N.) (Russell Sage Foundation, 2003).
- Hubbert, M. K. Nuclear energy and the fossil fuels. Presented to the spring meeting of the southern district, Division of production. American Petroleum Institute. Plaza Hotel, San Antonio, Texas. Publication no. 95, Shell Development Company. Exploration and productions research division, Huston Texas (1956).
- International Energy Agency. World Energy Outlook (2010).
- Ragnarsdóttir, K. V., Sverdrup, H. U. & Koca, D. Assessing Long Term Sustainability of Global Supply of Natural Resources and Materials. In Ghenai C. (ed.) Sustainable Development. Energy, Engineering and Technologies - Manufacturing and Environment. Chapter 5. Pp 83-116 (Intechweb publishers, 2012).
- Sverdrup, H. U., Koca, D. & Ragnarsdottir, K.V. J. Envir. Sci. Eng. 2 (4B), 189-222 (2013).
- Sverdrup, H.U., Ragnarsdottir K.V. & Koca D. Resources, Conserv. Recycling 87, 158-174 (2014).
- Sverdrup, H. U., Ragnarsdottir, K. V., Koca, D. & Petersen, T. Resources, Conserv. Recycling 83, 121-140 (2014).
- EU Thematic Strategy on the Sustainable Use of Natural Resources (2005) www.ec.europa.eu/environment/natres/
- Daly, H. Sustainable growth: An impossibility theorem in Valuing the Earth: Economics, Ecology, Ethics (eds Daly, H., & Townsend, K.) 45-47 (MIT Press, 1993).
- Daly, H.E., Cobb, J.B., Jr. For the common good: Redirecting the economy toward community, the environment, and a sustainable future (Beacon Press, 1989).
- Cobb, C., Halstead, T. & Rowe J. If the GDP is Up, Why is America Down? (Atlantic Monthly, October, 1995).
- Costanza, R., Hart, M., Posner, S. & Talberth, J. Beyond GDP: The need for new measures of progress (Boston University, 2009).
- Stiglitz, J. E., Sen, A. & Fitoussi, J. P. Mismeasuring our lives: Why GDP doesn't add up (The New Press, 2010).
- Costanza, R. et al. Nature 505, 282-285 (2014).
- van den Bergh, J. C. J. M. (2009) J. Econ. Psychol. 30, 117-135 (2009).
- Kennedy, J.F. (1968) www.jfklibrary.org/Historical+Resources/Archives/Reference+Desk/Speeches/RFK/RFKSpeech68Mar18UKansas.htm
- Giovannini, E., Hall, J. & Morrone, A. Revue d’Économie Politique 1, 121 (2011).
- Vadovics, E., Milton, S. & the CONVERGE Team Case Studies (‘initiatives’) Illustrating Contraction and Convergence. Equity within Limits in Theory and Practice. Green Dependent Institute, Hungary. Published under a Creative Commons Attribution-Non-Commercial-No Derivative Works 2.0 UK: England & Wales License. (2012) www.convergeproject.org/sites/convergeproject.org/files/CONVERGE_ebook_EquityWithinLimits_initiatives_doublepageprint.pdf
- Redefining Progress, Genuine Progress Indicator (Redefining Progress, 1995).
- Talberth, J., Cobb, C. & Slattery, N. The Genuine Progress Indicator 2006: A tool for sustainable develoment (Redefining Progress, 2007).
- Posner, S. M. & Costanza, R. Ecol. Econ. 70 1972-1980 (2011).
- Jowett, B. The Dialogues of Plato, Vol. 4, 263 (MacMillan & Co. 1871).
- Kawachi, I., Kennedy, B. P., Lochner, K. & Prothrow-Stith, D. Am. J. Public Health 87, 1491 (1997).
- Paskov, M. & Dewilde, C. Income inequality and solidarity in Europe. Research in Social Stratification and Mobility (2012).
- Elgar, F. J. Am. J. Public Health 100, 2311-2315 (2010).
- Kondo, N., Sambajwe, G., Kawachi, I., van Dam, R. M., Subramanian, S. V. & Yamagata Z. BMJ 339, b4471 (2009).
- Wilkinson, R. G. & Pickett, K. The spirit level: Why greater equality makes societies stronger (Bloomsbury, 2009).
- Krueger, A. B. The Foundations of Durable Racial Inequality (Center for American Progress, Washington DC., 2012)
- Stiglitz, J. E. The Price of Inequality: How Today's Divided Society Endangers our Future (Norton, 2012).
- Kubiszewski, I. et al. Ecol. Econ. 93, 57-68 (2013).
- Diener, E. & Biswas-Diener, R. Social Indicators Res. 57, 119-169 (2002).
- Diener, E., Suh, E. M., Lucas, R. E. & Smith H. L. Psychol. Bull. 125, 276-302 (1999).
- Kahneman, D. & Krueger, A. B. J. Econ. Perspect. 20, 3-24 (2006).
- Layard, R. Happiness: Lessons from a New Science. (Allen Lane, 2005).
- Dorling, D. & Barford, A. Health Place 15, 1166-1169 (2009).
- Barford A., Pickett, K. and Dorling Soc. Sci. Med. 70, 496-497 (2010).
- Sen, A. BMJ 324, 860-861 (2002).
- Kahneman, D. Thinking Fast and Slow (Farrar, Straus and Giroux, 2011).
- Costanza, R. et al. Ecol. Econ. 61, 267-276 (2007).
- OECD Better Life Index. www.oecdbetterlifeindex.org/.
- Extractive Industries Transparency Initiative. eiti.org
- Alliance for Sustainability and Prosperity. www.asap4all.org.
- De Vogli R. Progress or Collapse: The crises of Market Greed (Routledge, 2013).