Product has been added to the basket

Rock music

Figure 1 SEM micrograph shows that most of limestone grains are xenomorphic but there are some scattered straight crystal faces. Scale is 10m, indicating a range of some 4-12m, grain size range.

Seems the hills really are alive with the sound of music. Charles Howard1, Itzchak Dinstein2 and Dov Bahat3 have been listening to the song of the Earth… or rather, to a rock in their back garden.

Geoscientist Online October 1 2008


Since the very dawn of creation, as the Sun has risen and set in the sky, the surface of the Earth has been heating up and cooling down. This causes a 24 hour cyclical expansion and contraction of every rock, hill, mountain and every piece of other surface matter - a vibration with a frequency of one cycle per 24 hours. Within this cycle, many small variations occur, depending on the nature of the material, its shape, inclination, constituents, porosity, wetness, or overlying vegetation. Further variations are caused by the weather - cloud cover, humidity, shadows etc. These variations in turn vary with the seasons, from year to year, decade to decade, millennium to millennium, aeon to aeon.
Figure 2 A close up of the strain gauges and thermocouple prior to covering with rubber insulation. Mountains and rocks are long-lived; for them, perhaps one cycle per 24 hours is not particularly slow. Unfortunately we are unable to hear this terrestrial music. Our hearing can perceive vibrations between 20 and 20,000 Hz, and frequencies outside this range do not register as sound to us. But we already know of methods to make the high frequency sounds of, for example, whales and bats audible to humans, by recording and slowing down the vibrations they emit into the 20-20,000 Hz range. What we have tried to do is similar to this, by speeding up a recording of the expansions and contractions of one small limestone rock measured over one year.

We used one small stone. It was a local limestone rock taken from the river bed of River Beer-Sheva (which is actually a river for only a few days each year during heavy winter rains). This was a typical, natural rock, set in a more or less natural environment. Limestone was chosen because it consists of micro-crystals of calcite, an anisotropic mineral that expands and contracts extensively1. Calcite’s thermal expansion differs drastically along the mineral’s two principal crystallographic axes. However in limestone, calcite crystals are randomly oriented; such that the anisotropic thermal expansion effect is neutralised, and may in bulk be considered isotropic. The micro-structure of this rock is shown in Figure 1.
Figure 3 The rock is in situ in the garden. The exposed faces with gauges 1, 2, and 3 can be seen.

“Miking up” a rock


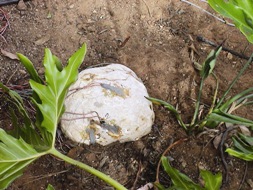
Eight Tee rosette Vishay strain-gauges (C2A-06-125LT-350) were bonded onto various sites on the face of this rock using the method and epoxy resin recommended by the gauge manufacturer. Next to each strain-gauge a thermocouple was also bonded onto the rock (Figure 2). They were then coated with 3145 RTV Protective Coating - a rubbery material to protect the gauges from direct contact with water (again, on the manufacturer’s recommendation). The rock was placed in one author’s garden, and exposed to the changing conditions of day and night (Figure 3).

Each gauge measured microstrain (change in length expressed in parts per million). One gauge from each rosette was chosen and attached to one of two Vishay P3 Strain Indicator and Recorder (each recorder had four channels). The microstrain from each strain gauge was recorded every five minutes. The temperature at the site of each strain gauge was also recorded every five minutes using a PICO TC-08 thermocouple data logger.

Channels 1,2,3 and 4 were on the exposed surface and channels 5, 6, 7, and 8 on the buried surface of the rock. Data from each channel were downloaded into a Microsoft Office Excel worksheet. This was converted from an .xls file to a .wav file using Matlab software. Matlab enables the user to specify the sampling frequency of the sequence of samples to be recorded as an audio WAV file.

As mentioned before, the basic frequency of one cycle per 24 hours has to be increased to somewhere within the human hearing range of 20-20,000 Hz. The original signal was sampled at a rate of 12 samples per hour, or 288 samples per day. The sampling frequency for the WAV files was specified as 10KHz, i.e., increasing the sampling rate from one every five minutes to 10,000 per second, speeding up the “sound” by a factor of 3,000,000 . The resultant audio frequency of the WAV files was 10,000/288=34.7 Hz. The “.WAV” files for each individual channel and a combined “.WAV” file of all the channels for the first six months (Dec 2005 to June 2006) accompany this article (Audio Files 1-12).

Figure 4 Graph of variation of microstrain of the readings from all the channels for the first four months (18 December 2005 - 13 April 2006).

Hitches and glitches


However the author’s back garden is a harsh environment, and recordings from channel 8 were lost after one month - presumably due to a poor bond onto the rock face. This left seven channels. Although it was hoped that recordings could be made for one year, technical problems with the Vishay data loggers (water entry) caused them to fail after only six months. It was possible to repair one of them and about a further four months’ data were collected from four gauges (channels 2, 4, 6, 7). The details of collection dates are shown in the table.

Examples of these data are shown in graphic form in figures 3 and 4. Sufficient data were obtained to produce an interesting and, in our view, exquisite, sound.

Figure 5 Graph of one week’s readings. The overall 24 hour cycle can be distinguished and superimposed on this the smaller variations in expansion/contractions due to cloud cover, shadows and other temperature variants.

Heat flow


During the day, the superficial part of the rock heats up quickly and heat thus flowed into the rock. At night, the superficial parts cool quickly and the heat flow is reversed. The diurnal temperature range is greater for the exposed surface than for the buried one, and we detected small fast-changing variations (due, for example, to passing clouds, changing shadows). There is a time lag in between the responses of these two surfaces (it takes time for the heat to flow through the rock). This lag is mirrored in the expansion/contraction curves. This is intrinsically beautiful; producing a constantly reversing relationship between the superficial and deeper parts of the rock (Figure 6). Furthermore there were slight differences between the superficial sensors. McFadden et al.3 postulated that this difference was due to the east/west orientation of the parts of the rock and was, at least in responsible for the cracking and erosion seen in desert environments.

The temperature never dropped below freezing during the year investigated (Dec 2005 to Dec 2006), but it would have been very interesting to note how this would have affected the readings.

The speeding up of the recording from 1 cycle per 24 hours to 10KHz meant that one year’s recording was compressed into about nine seconds of sound .The “sound” consists of a basic “blip” representing the regular 24hr cycle, but it is noticeable that the amplitude of the beginning and ends (during the winter) is less than the summer and there is a continual background variation.

Figure 6 Three days’ temperature recordings from one exposed (purple) and one buried (blue) thermocouple. Note time lag between exposed and buried surfaces. During the day exposed surface heats quickly and heat flows inwards to the buried surface.

Conclusions


We listened to the song of just one small rock by measuring seven small points on its surface for an eye-blink of time. In reality, every piece of rock, mountain, building, varying with its composition, coefficient of expansion, shape, size, position on and within the Earth is, has, been and will be vibrating for eons. It is if we have deciphered one semiquaver in an enormous orchestral symphony, and made us aware of the intense physical activity of the universe occurring around us of which we are usaully completely unaware.

References


  1. Wu T C, Shen A H, Weathers M S , Bassett W A; 1995. Anisotropic thermal expansion of calcite at high pressures: An in situ X-ray diffraction study in a hydrothermal diamond-anvil cell American Mineralogist, 80, 941-946.
  2. Bloss, D F, 1971 Crystallography and crystal chemistry Holt, Rinehart and Wilson, Inc New York pp 545.
  3. McFadden, F D, Eppes, M C, Gillespie A R, Hallet B 2005. Physical weathering in arid landscapes due to diurnal variation in the direction of solar heating GSA Bulletin, 117, no 1/2; , 161–173.

Author details


1Macabee Health Clinic, Kiryat HaMenshalah, Beer-Sheva, ISRAEL;
2Electrical and Computer Engineering Department, Ben-Gurion University Of the Negev. Beer-Sheva, 84105, ISRAEL;
3Department of Geological & Environmental Sciences, Ben-Gurion University of the Negev, P.O.B.653,Beer-Sheva, 84105, ISRAEL,

Song of the Earth - now hear this....

Below are .wav files (that require an appropriate media player to be installed on your computer). They will allow you to hear the sound created by speeding up the cooling and heating cycles of the rock. Individual channels as indicated.  All channels together - file to top.