Heavy rains in 2012 saw media and social media report a seemingly astonishing number of landslides. But was it real? Catherine Pennington and Anna Harrison investigate.*
In 2012, trains were cancelled, traffic diverted and houses pulled down as a result of landslides, at a cost of millions of pounds - the cause? Rain - and plenty of it. In January, the Met Office annual statistics for 2012 showed that it was the second wettest year in the UK since national records began in 1910. From July onwards, media interest in the effects of all this rain gained considerable momentum; damage and disruption due to floods and landslides became the hot topics of the moment. However, analysis carried out by the Landslides Team at the British Geological Survey (BGS) poses questions about the way in which landslides are reported, especially with respect to the power of social media.
RELICTS
Ask the average person about landslides in Great Britain and they will probably tell you that there are a few. Some may point to the famous ones, like Mam Tor in Derbyshire or Holbeck Hall in Yorkshire. Most are surprised to learn that there are more than 16,000! Fortunately, a large proportion of these are relicts from the end of the Late Devensian glaciation and most (though not all) currently lie dormant. For the most part, these do not pose a threat to people, homes or infrastructure; but it is vitally important to know where all these landslides are, as they may be reactivated by, for example, changes to the weather - such as that seen in 2012.
Geologists at BGS have been collecting information on landslides as part of regional geological surveys since mapping began in 1835. All this information is held in the BGS National Landslide Database, the definitive source of information on landslides in Great Britain. In addition, the Landslides Team started to monitor the media for news reports of landslides in 2006, incorporating social media in 2012, and have found some interesting correlations between landslides and rainfall.
LANDSLIDES 2012
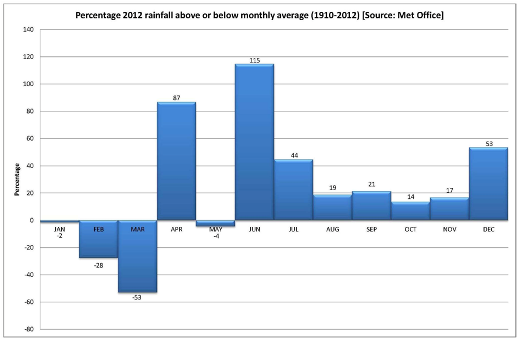
Caption: Rainfall data interpreted as percentages above or below the average rainfall for the time of year (Source: Met Office).
The extraordinary amount of rain in 2012 saw an increase in the number of landslides reported around the country. In July, 21 landslides were reported in the media, or four times the national average for that time of year. Three people were killed and at least six injured. In November, 37 landslides were reported - three times the national average. In December, this rose to 67 or over four times the national average.
The map shows the location of the 2012 landslides (red dots) with respect to the annual rainfall seen in 2012 as published by the Met Office. It is clear that the areas which experienced well above-average amounts of rain (dark blue) coincide with landslides reported, particularly in south-west England - highlighting the importance of hydrogeological triggering as a main driver of slope instability.
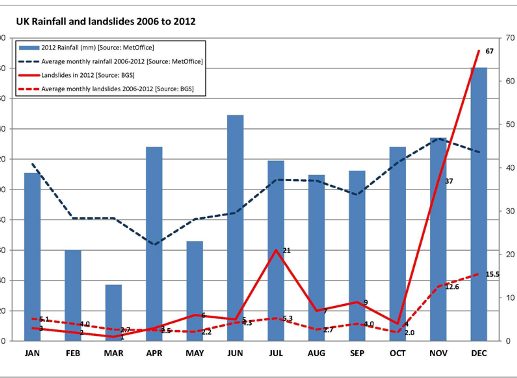
Caption: Graph to show the number of landslides reported against rainfall. Landslides in 2012 (red solid line), average number of landslides reported 2006-2012 (red dashed line), 2012 rainfall (blue bars; Source: Met Office) and average rainfall 2006-2012 (blue dashed line; Source: Met Office).
A large proportion of these landslides occurred on man-made slopes, such as road and railway embankments and cuttings. Such ‘slope failures’ are usually small-scale slumps or flows triggered by heavy rainfall and happen within a short time of prolonged heavy rain. Data collected in 2012 reflect this trend.
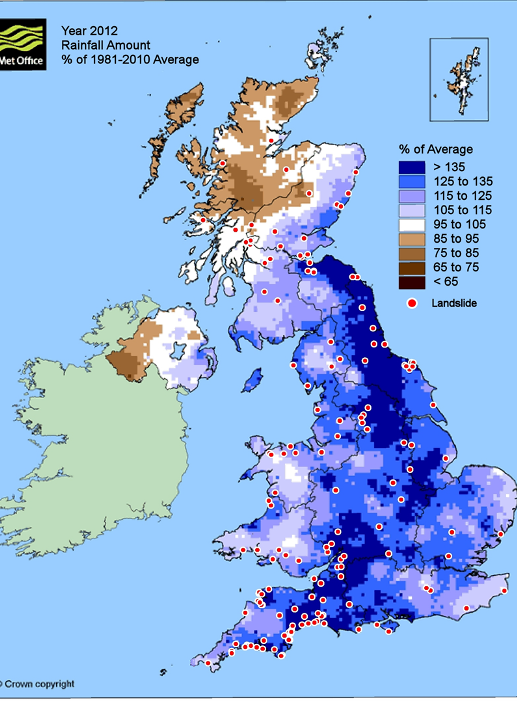
Caption: Map showing the location of the 2012 landslides (red dots) with respect to the annual rainfall received in 2012. Source: Met Office.
A closer look at the statistics for 2012 showed some interesting relationships between landslide occurrence and monthly rainfall. These cursory statistics are a national overview based on monthly data for the UK. More detailed work is being done to analyse the data on regional and daily time-scales further, as well as elucidate the relationships between effective rainfall, geology and landslides. We know that:
- 43% of the variance in the number of landslides in the UK is explained by the current month’s rainfall. In comparison, 61% is explained by considering the rainfall for the two months preceding the event. However, extending this to include the antecedent three months weakens the relationship.
- as might be anticipated, slope failures show a closer relationship with rainfall (48%) than landslides on natural slopes (43%), suggesting that deep-seated natural landslides are less driven by rainfall as they exhibit more complex geotechnical conditions and their hydrogeological response is more complex.
FACT OR ‘TWICTION’?
But is this a true representation of what happened in 2012, or a result of better reporting by local authorities, coastguards, highways agencies and Network Rail to inform the public of delays and diversions? Is it a result of media hype, whereby more landslides are reported to keep the story about a year of excessive rainfall and flooding rolling? Or are social media now playing a larger role in capturing information, and skewing the data?
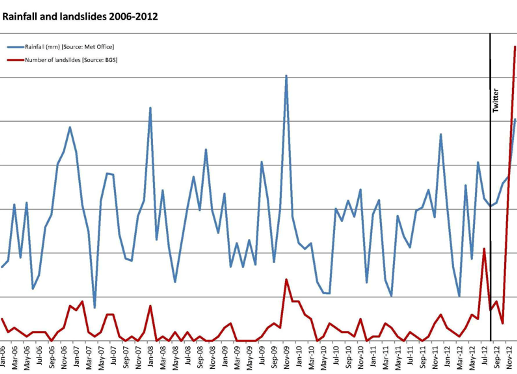
Caption: Graph showing the number of landslides (red line) and the amount of rain (blue line) from 2006 to 2012. There is clearly a relationship between the amount of rain and the number of landslides being reported in the local and national media; an increase in rain saw an increase in landslides. With the addition of information from Twitter from August 2012 onwards, the number of landslides reported increases three to four times the national average for the time of year.
Over the past six years, the BGS Landslides Team has monitored the published online press for information about landslides through various Internet search engines. This would often mean they would find out about the event the following day at best, unless it was headline news. In August, the Landslides Team became @BGSLandslides and has been searching for information on landslides through Twitter.
Once someone tweets about a “landslide” or “landslip” the team can form a picture of, and start to monitor, what is happening very quickly. Take the Burton Bradstock rock fall (see case study below). This tragic event occurred at 1230hrs and the Landslides Team knew about it before 1300hrs via Twitter.
News reporting of landslides seems to take a familiar format. The first words are mentioned on Twitter and, depending on the impacts caused by the landslide, several are tweeting about it within minutes. Some people may upload photographs or videos from their mobile phones. A dialogue is often open between the public and, say, Network Rail where questions are asked and information exchanged. The public now expect to be able to find out about travel delays from the comfort of their train seats.
The media then get hold of the information and publish, usually within the hour, a holding webpage with what they have gathered from these reports. A more detailed article is published shortly afterwards in several places, such as the local and national news web pages, once the journalists have either been on-site themselves or gained additional information from other sources. This rate and detail of reporting is a far cry from the days of waiting for the newspaper to be delivered and cutting out the article. It has revolutionised the ease and rate at which hazard analysts can collect new event data.
TIME & NUMBER
The time in which landslides are being reported has speeded up enormously through Twitter, but it is also likely that the number of landslides being reported has increased too. Or to put it another way, we may now be getting a more accurate picture of the true number of landslides than we were before, though at the expense of creating a false impression that more landslides are happening in total. For example, a small landslide that has partially blocked a minor road would previously be unlikely to make the press. Now, it is just as likely to be mentioned on Twitter as a larger landslide.
We have plotted the monthly number of landslides (red line) and the amount of rain (blue line) between 2006 and 2012. There is clearly a relationship between the monthly rainfall total and the number of landslides being reported in the local and national media; an increase in rainfall amount saw an increase in landslides. However, with the addition of information from Twitter from August 2012 onwards the number of landslides reported increases three to four times the six-year national average for the time of year.
So are more landslides really happening? Taking into account the extraordinary rainfall seen in 2012, it is most likely that more landslides have occurred, particularly those shallow, small-scale, rapidly-responding slope-failures such as those seen in the data. However (and without exception) all landslides reported in 2012 have been described in the media and social media because they have had an impact on the lives of people - through road diversions, rail delays, homes demolished or the closure of coastal footpaths.
While these are valid reports, it is also likely that more landslides occurring in 2012 went undetected because their impacts were insufficient to warrant reporting. This may be especially true for those larger and older landslides, which may have started to reactivate but have no immediate impact on the public. We will be testing this theory through follow-up communication with Local Authorities and by continuing to monitor the media and science literature.
Larger deep-seated landslides are less likely to be as responsive to heavy rainfall as smaller shallow ones becaue water takes longer to filter down to the slip surfaces and increase pore pressure to critical levels. This ‘lag time’ will, we hope, be recorded in the data we collect, should there be an onset of larger landslides occurring or reactivating.
As an example, the Mam Tor landslide moves on average 0.5m per year and this rate is exacerbated by quite small rises in groundwater levels2,3. We have now had over six months’ above average rainfall (since June 2012), so it will be interesting to see if many of our well-known deep-seated landslides reactivate in coming months, or if new larger landslides occur.
BURTON BRADSTOCK
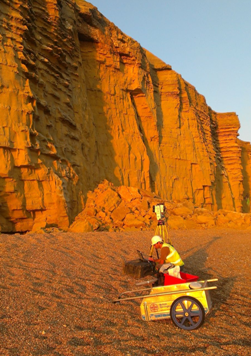 Caption: The rock fall at Burton Bradstock. BGS Landslides Team carrying out LiDAR survey of the landslide and cliffs; Right: the landslide debris.
Shortly after 1230 on 24 July 2012, the BGS Landslide Response Team received reports of a large rockfall on the Jurassic Coast at Burton Bradstock in Dorset. There were, in fact, two events approximately 20 minutes apart. Several people were injured and, tragically, 22-year-old Charlotte Blackman from Derbyshire was killed. The rockfall was widely reported in the media, including Twitter, and the beach and coastal cliff-top footpath were later closed temporarily to protect the public. Rockfalls have been reported and photographed along this section of coast for decades. In February 2012, a couple walking along the same beach narrowly avoided one probably caused by thawing of a deep frost; another fall came down after heavy rain in January 2013.
The fall in July 2012 was probably triggered by a combination of natural factors including prolonged heavy rainfall, coastal erosion, stress release and long-term deterioration of the rock strength by weathering and possibly even thermal expansion; these are natural processes that play a continual role in weakening cliffs. The antecedent rainfall through July had saturated the high porosity sandstone rock, increasing its unit weight and raising pore pressures in the slope, particularly between the wide-open joints and bedding planes, effectively reducing the slope’s overall resistance to gravity. The rockfall debris ran out by 30m onto the gently sloping gravel beach, rapidly depositing a pile of rubble approximately 20m wide and up to 10 m high.
The 40m-high sea cliffs between West Bay and Burton Bradstock mostly comprise the Jurassic Bridport Sand Formation, a shallow marine fine-grained sandstone with irregularly placed stronger calcite cemented sandstone beds and lenses that weather to a yellow colour and protrude from the cliff face every metre or so as seen in the photographs. When the Bridport Sand Formation sandstone is dry it is typically a weak to moderately strong rock; but once saturated it weakens considerably rendering these cliffs more susceptible to failure during prolonged periods of wet weather when groundwater levels are elevated and slopes saturated by rain or melting snow and ice. Most of the landslide deposit was composed of the Bridport Sand Formation with blocks up to 2 m3 in the landslide debris.
Above the Bridport Sands rests the Inferior Oolite Group, a three-metre thickness of limestone beds forming a resistant cap. The presence of widely spaced orthogonal joints generates large (2m x 2m x 0.5m) blocks that are seen in the landslide debris and provide a regular source of fossils for the many fossil hunters who visit the Dorset Coast every year. The cliff is capped by several metres of Fuller's Earth, a grey calcareous mudstone which typically erodes as mudflows that cascade down the cliff onto the beach.
The fatal landslide was a sad reminder of the dangers of rapidly-moving landslides that give little or no warning, and cautions us all not to approach recent rockfall sites that might still be actively eroding, and to take safety precautions when working under potentially unstable slopes.
REST AND BE THANKFUL
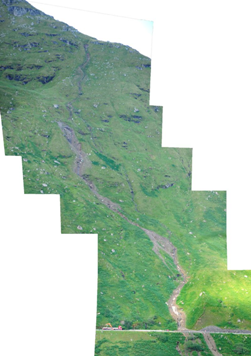 Caption: Landslide deposit blocked the road on the A83 Rest and Be Thankful Pass in August 2012. Composite picture shows the debris flow path above and below
On 1 August 2012 following a period of heavy rain, a debris flow landslide occurred along the A83 Rest and Be Thankful pass in Argyll and Bute. It was reported that 50 to 100 tonnes of material blocked the road, which was subsequently closed in both directions.
While this may not be a large landslide in a national context, its impacts were disproportionately large. The Rest and Be Thankful Pass lies near the bottom of a slope prone to debris flows that have closed this road frequently in recent years. Its closure means a 55-mile detour for all residents, commuters and businesses in the area, costing the local economy £50,000 a day. The cost of engineering a permanent solution to the problem could be as much as £520 million4.
The debris flows occur on steeply sloping ground underlain by the Neoproterozoic Beinn Bheula Schist Formation, comprising very strong metamorphosed psammites and semipelites composed largely of quartz, feldspar and mica, commonly intensely foliated and spectacularly folded. Bedrock plays relatively little part in landslide activity on these slopes, however, and the recent debris flows have largely been associated with slope deposits - including peat, topsoil and underlying colluvium. Colluvium deposits on this slope represent earlier phases of slope instability and comprise sandy to gravelly silts and clays, with varying amounts of cobbles and boulders. It is also likely that conditions were exacerbated by the additional input of water from bedrock pathways, where jointing or fracturing occurs, due to groundwater flux from the heavy rain leading up to the event.
* Landslides Team, British Geological Survey. Have you seen a landslide? The BGS Landslides Team can be contacted E: [email protected] or through Twitter (@BGSLandslides) or you can fill in an online form www.bgs.ac.uk/landslides/reportForm.html.
Further reading
- Boon, D, Morgan, D & Pennington, C (2012) Burton Bradstock rock fall, Dorset, http://www.bgs.ac.uk/landslides/burtonBradstock.html
- Waltham, T & Dixon, N. (2000) Movement of the Mam Tor landslide, Derbyshire, UK. Quarterly Journal of Engineering Geology & Hydrogeology, v33 (2), pp105-123.
- Rutter, E H & Green, S (2011) Quantifying creep behaviour of clay-bearing rocks below the critical stress state for rapid failure: Mam Tor landslide, Derbyshire, England. Journal of the Geological Society, London, v168, 2011, pp 359–371.
- Symes, C (2013) New report presents options for landslide-prone A83 in Scotland. Ground Engineering, February 2013, p4.
Acknowledgements
The authors would like to acknowledge the other members of the current BGS Landslides Team: Dr Claire Dashwood, Dr Tom Dijkstra, David Boon, Alick Leslie, David Morgan, Hannah Jordan, Peter Hobbs, Katy Freeborough, Emma Ward, Dr Vanessa Banks and Dr Helen Reeves.