Product has been added to the basket

Glaciers - no nonsense science

Prof. Mike Hambrey, in his natural habitat

Michael Hambrey1, Jonathan Bamber2 Poul Christoffersen3 Neil Glasser1 Alun Hubbard1 Bryn Hubbard1 and Rob Larter4 defend their subject against unfounded accusations of "misconception" and "alarmism".

Geoscientist Online 1 April 2010


As glaciologists and glacial geologists, we respond to the article “Glaciers – science and nonsense” by Cliff Ollier in the March issue of Geoscientist1 .  We believethat the standfirst of this piece, which states that the author “takes issue with some common misconceptions about how ice-sheets move, and doubts many pronouncements about the “collapse”  of the planet’s ice sheets” misleads the reader by assuming that Ollier’s arguments are correct. We demonstrate in this article that those arguments are not, in fact, based on an accurate understanding of contemporary glaciology.

First, It is important to understand that when glaciologists occasionally refer to the ‘collapse’ of ice sheets they do not mean disappearance in a few years, but refer to a positive feedback whereby incremental change can lead to larger changes and, ultimately, to complete demise. The contentious issue in glaciology is not whether such collapse can occur, because it has and does (see below) - but the timescale over which collapse occurs.

Ollier argues that ice sheets cannot collapse and that research that demonstrates rapid ice sheet melting and thinning resulting from acceleration of flow (“dynamic thinning”) is ‘alarmist’. Ollier’s stance largely disregards fundamental developments in our understanding of glaciers and ice sheets that have been achieved since the 1950s through a combination of laboratory experiments, fieldwork and (more recently) remote sensing – as reading of fundamental texts such as that by Paterson would reveal. Physical glaciology is undoubtedly a young discipline founded in the post-WWII ‘process-engineering’ era, but to suggest, for example, that scientists are unaware of the basic principles of ice motion through creep deformation, basal sliding and sub-glacial sediment deformation is countered by the fact that there are thousands of critically-reviewed papers that investigate these processes on a variety of scales.


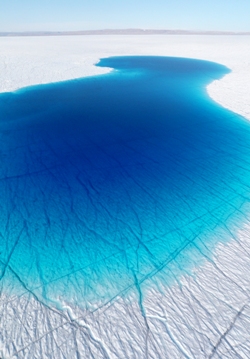
Fig. 6. Seasonal meltwater lake on the Greenland Ice Sheet. Note the network of supraglacial channels flooded by the lake. Pic - Alun Hubbard
In this article, we redress the balance, and in so doing demonstrate the basis of our concern for current and future ice-mass recession and its contribution to sea-level rise. Our response is structured around five general themes that are misrepresented by Ollier in his argument that ice sheets are not responding to recent climate warming. These are
  1. that ice motion is predominantly achieved through ‘creep’,
  2. that iceberg calving and calving-related processes do not influence the motion of the interior ice sheet, 
  3. that current rates of ice-mass flow and iceberg release are not controlled by recent, but by ancient, changes in climate,
  4. that ice sheets have been stable for long periods of time and are therefore insensitive to changes in climate, and
  5. that contemporary advance of certain valley glaciers indicates that there is no evidence of climate warming.

Misconception 1: theories based on ice sliding on a lubricated base have very limited application because ice motion is predominantly achieved through ‘creep’


Ollier states that “theories based on ice sliding on a lubricated base have very limited application” and that ice-sheet flow is achieved almost entirely through ice deformation or creep. This statement is erroneous, and ignores the fact that the majority of the Earth’s ice masses move through a combination of ice deformation and basal motion, composed of basal sliding and the deformation of subglacial sediments. Indeed, where direct measurements have been made of the relative contributions of the different motion components, basal motion often accounts for as much as 80% of the total ice velocity. This has been observed at small temperate mountain glaciers as well as at 50km-wide ice streams in Antarctica. Indeed, it has been estimated that c.90% of the annual ice loss from Antarctica, and c.50% of that from Greenland2,3, occurs through the discharge of ice streams and outlet glaciers, the rapid motion of which is facilitated by the presence of basal meltwater. Numerous studies correspondingly reveal that fast ice motion, and rapid changes in motion, are overwhelmingly controlled by variations in basal motion and not creep – which is rate-limited and relatively steady, and insensitive to changing external forcing factors. It is only variations in basal motion, therefore, that are capable of explaining the dramatic changes in the rates at which ice streams move that have been recorded in the past decade or so.

Satellite images clearly show that surface meltwater forms lakes and supraglacial rivers on the Greenland Ice Sheet, even well up into the firn zone, and much of this water seasonally drains to the bed. The seasonal speed up of the western margin of the Greenland Ice Sheet has been observed from satellites4 and from ground-based GPS measurements5. In some cases the ice surface has speeded up by up to a factor of four. Continuous centimetre-accurate geodetic-GPS measurements made across and up to 100 km from the margin of the Greenland ice sheet further indicate a strong daily cycle of horizontal and vertical displacement, both synchronous with, and proportional to, the timing and magnitude of diurnal surface melt-water production6,7.

That this observed daily velocity cycle is also accompanied by extensive vertical uplift of the ice surface, both of which are in phase with peak melt-water production, provides a direct link between surface melt and subglacial ice dynamics, and specifically with hydraulic-pressurisation (inducing uplift) at the ice-bed interface.
Ollier disregards a large body of observational evidence by claiming that meltwater does not form on ice caps. He also disregards observational evidence when he claims that water can only penetrate through the ice if crevasses reach the bed. Every part of these statements is inaccurate. For example, the process of hydro-fracturing provides a mechanism for extending surface crevasses to depth, while water-melted sink holes, or ‘moulins’ very effectively transfer water from the surface of ice masses to their bed – even through ice thicknesses of up to one kilometre8. Although the impact of this process is still unclear, the evidence for drainage of water through thick polar ice, from the surface of the ice sheet to the bed, is incontrovertible.

Even in areas where there is little or no surface melting, as is the case for most of Antarctica, the beds of ice streams are generally lubricated as a result of basal melting. Basal melting occurs under thick ice where the combination of overburden pressure and the geothermal heat-flux result in ice at the bed being at the pressure-melting point, even though mean annual surface temperatures are c.20 oC or even colder. Once fast flow has been initiated, strain-heating and bed friction also contribute to basal melting.


Fig. 2. Rapid recession and iceberg generation has been a characteristic feature of many Greenland glaciers in recent decades, as depicted here by Kangerdlussuak Glacier in East Greenland (Pic: Mike Hambrey).

Misconception 2: iceberg calving and calving-related processes do not influence the motion of the interior ice sheet


Penetration of surface meltwater to glacier and ice sheet beds is not the only process that has been observed by glaciologists in the regions where satellite remote sensing has revealed rapid variations in glacial activity. Accelerated ice motion has also been detected in places where warm ocean conditions have resulted in high rates of submarine melting and retreat of calving glacier fronts. However, Ollier’s simple, but invalid, assumption is that glaciers only flow by creep. The fact is that retreat and thinning of calving glacier fronts is accompanied by loss of resistance to flow, and as a consequence the grounded portion of the glaciers do indeed speed up. Two mechanisms contribute to this acceleration. The immediate response to loss of ice-frontal resistance is inland transmission of longitudinal stresses, which stretches and thins the lower part of the glacier. The second and delayed response is inland migration of thinning, which further increases speed because downstream thinning increases the flow-parallel surface gradient and thus elevates the gravitational driving force.

The current acceleration of Pine Island Glacier in West Antarctica is a good example of the delayed response to coastal forcing. Data acquired with high-precision GPS instruments on this 40km-wide ice stream show that thinning originating from the calving front travelled 200km inland in less than a decade and that annual acceleration of 4% per year is taking place 170km from the grounding-line9. Speed is changing by c.12% per year near the coast where this ice stream moves at rates of more than 3km per year. This change is obviously important because Pine Island Glacier and the neighbouring Thwaites Glacier account for 35% of all ice discharge from the West Antarctic ice sheet, and their current state of imbalance are responsible for >60% of the current net annual ice mass loss, which is estimated to be >100 Gigatons per year2.

The immediate response to ocean-forcing is best exemplified by the recent doubling of glacier speeds of several glaciers in Greenland10. These events were rapid, widespread and synchronous, and their occurrence from 60oN to 70oN in southeast Greenland11 coincides with observed warming of waters in coastal currents12.  The events were clearly caused by current environmental factors and not by internal instability. Natural glacier surges can be ruled out because simultaneous surging on this spatial scale is extremely unlikely. The direct link between oceanic conditions and glacier dynamics is clearly seen in the melting of calving glacier fronts, which occurs at rates of several metres per day in summer and up to tens of metres per year on average. The proposition that these events are completely unrelated to the modern environmental factors is clearly wrong. The ice loss resulting from acceleration of outlet glaciers in southeast Greenland was 70 Gigaton per year in 2003-20083. This is 74% of the ice sheet-wide mass imbalance by discharge or 30% of the total annual mass imbalance. Ice-water interactions at calving glacier fronts are complex and difficult to document, but it is clear that calving processes influence the rates at which ice is discharged to the ocean.


Fig 3. Hubbard Glacier, Alaska, which has been advancing for over a century, but this behaviour is anomalous, since 98% of Alaskan glaciers are in recession (photograph by M. J. Hambrey).

Misconception 3: ice sheet discharge and iceberg release are controlled by ancient changes in climate


Ollier states that “destruction at the ice front [calving] does not depend on present day climate…. that the point to remember is that the release of icebergs at the edge of an ice cap does not in any way reflect present-day temperature”. We cannot let this statement go unchallenged. Ollier seems to believe that abrupt and widespread glacial phenomena, such as glacier acceleration, are the result of palaeoclimatic temperature fluctuations and creep. This idea can be readily discounted, given that a vast and growing body of non-contentious scientific evidence clearly shows that discharge from ice sheets is not controlled by creep, and that current changes in glacier dynamics can be explained by present-day climate and ocean interactions. It is true that the interior basal parts of large ice sheets may typically take thousands of years to respond and equilibrate completely to mass-balance changes in their interior.

However, as noted above, the Earth’s ice sheets now lose mass not as a result of these (relatively slow) changes, but by submarine melting and iceberg calving from fast-flowing ice streams that terminate in ocean water. The rate of calving from these ice streams is related to the rate at which ice is supplied to them, i.e., to ice velocity, and these velocities have been shown to have increased recently as a result of ice-marginal processes. Short-term increases in iceberg production therefore reflect correspondingly recent warming-related processes and not more widespread ice sheet-scale equilibration to past climate change, as Ollier incorrectly states.

It is worth noting here that these processes of iceberg calving may be fundamentally different from the well-documented break-up and loss of major portions of the Earth’s largest ice shelves, which intermittently occurs naturally. These events are part of a long-term cycle of slow build-up over many decades, followed by sudden break-out when they become unstable. That said, the rapid break-up of seven out of twelve ice shelves in the Antarctic Peninsula (with a total reduction of ice shelf area of 28,000 km2 over the last 50 years), where temperatures have risen at a rate of 3.7±1.6°C per century, can clearly be attributed to regional atmospheric and oceanic warming13. Here, there is a clear correlation between the break-up events, the southward migration of isotherms, and the incidence of summer surface-melt (measured in terms of positive degree days). In the case of Larsen A and B ice shelves, basal melting may also have been a factor, but we don’t have the historical record to be certain that the rates preceding break-up were unusual.

Ollier is correct in saying that ice shelves do not contribute directly to sea level rise (because they are floating in equilibrium with the sea). However, their collapse does contribute to sea-level rise because they can no longer buttress the outlet glaciers that feed them, causing destabilisation and draw-down14,15,16. For example, remotely sensed glacier velocity and elevation measurements show that tributary glaciers thinned and accelerated following the collapse of the Larsen B Ice Shelf, increasing ice discharge into the ocean17,18.


Fig. 4. One of many Himalayan glaciers losing mass, Khumbu Glacier, Nepal. The uneven glacier surface mantled by debris. Substantial downwasting evident from the Little Ice Limit, defined by fresh moraine scar across middle of picture (M Hambrey)

Misconception IV: ice sheets have been stable for long periods of time and are therefore insensitive to changes in climate


Ollier argues that ice-sheet longevity is synonymous with a stable history, and states that “the Greenland icecap [sic] has existed for three million years and the Antarctic ice sheets 30 million”. These claims are misleading; all ice sheets (defined as having a surface area of >50,000 km2, which therefore include Greenland, the Antarctic Peninsula, East Antarctica and West Antarctica) have fluctuated dramatically in both shape and volume, as indicated by a combination of deep-sea and continental shelf drilling. Whilst the Greenland Ice Sheet appears to have first formed at least 7.3 million years ago19, it has waxed and waned markedly since then. For example, it was much reduced during the last interglacial (the Eemian) around 110,000 years ago, when global sea level was 5 – 8 m higher than at present20. Similarly, the West Antarctic Ice Sheet has been characterised by widespread fluctuations during its ~15 million year history. Even the largest and longest lived ice sheet, East Antarctica, which probably first reached the coast ~34 million years ago, has experienced notable fluctuations – although the extent and timing of these fluctuations is hotly debated by experts. These changes have been determined from 30 years of drilling on the Antarctic continental shelf and the surrounding oceans, most recently by the international ANDRILL programme21. The Earth’s ice sheets have therefore been anything but stable through geological time.

In an associated argument, Ollier claims that the Earth’s ice sheets are stable because they are constrained within deep bedrock basins. Again, this claim is false for at least three reasons. First, the stresses driving grounded ice motion depend sensitively on ice thickness and ice surface gradient, and only to a lesser degree on the gradient of the bedrock upon which they lie. Thus, to state the obvious - ice flows downhill - but ‘downhill’ here relates strictly to the ice sheet surface and not to the bedrock basin on which it rests. Hence, ice can, and commonly does, actually flow up and over reverse bedrock slopes because of the higher surface elevation of the interior ice. Second, and more detrimental to Ollier’s argument, the bedrock boundaries of ice sheet basins are frequently breached by major troughs through which the bulk of accumulated ice is discharged as fast-flowing ice streams or outlet glaciers (as noted above).

No other process other than basal sliding of glaciers and ice streams can explain the over-deepened basins found in areas affected by glacial erosion. It is these ice streams and outlet glaciers that overwhelmingly drain the ice sheets’ interior reservoir of ice to the oceanic sink. As noted above, it is realistically only through variations in the rate of movement of these ice streams that rapid changes in climate can be transformed into (almost) equally rapid changes in ice motion and mass loss. Thirdly, part of the topography of these “deep bedrock basins” is the result of isostatic depression by the ice load itself. When ice starts to thin, the isostatic rebound reduces the depth of the basin (by the ratio between ice and upper mantle densities, i.e. about three metres for every 10m reduction in ice thickness22.


Fig. 5. The largest outlet glacier in Antarctica , the Lambert, from Fisher Massif, draining the heart of Antarctica (photograph by M. J. Hambrey).

Misconception 5: that contemporary advance of certain valley glaciers indicates that there is no evidence of climate warming


Thus far we have described how ice masses respond dynamically to climate change – and most of the Earth’s ice masses are currently responding in this manner. However, it is also true to point out that several glaciers are currently advancing – and Ollier incorrectly cites such cases as evidence that ice masses are not currently receding in the face of climate change. Once again, Ollier’s argument cannot be substantiated – for every glacier that is currently advancing there are probably hundreds that are receding.

The relationship between climate and any single ice mass is actually fairly complicated, with mass changes being driven by both temperature and precipitation and being mediated by processes of glacier motion (which redistributes the ice, continuously adjusting the glacier’s geometry). Thus, a particular glacier can advance because of, for example, local increases in snowfall, despite summer warming. That some glaciers advance is therefore not at all surprising; indeed it is a major cause for concern that, allowing for local precipitation changes, so few of the Earth’s glaciers are currently advancing. Glaciers grow or shrink in response not only to temperature but also to precipitation.

Ollier cites the Hubbard Glacier in Alaska (Fig. 3), which has been advancing since 1895, largely because it emanates from a large accumulation area at exceptionally high elevation where significant snowfall has been maintained23. He refers to it surging in 1986 “at the height of global warming”, but this contradicts the fact that it has been advancing nearly continuously for over a century. In fact it was a tributary (the Valerie Glacier), that enters Hubbard Glacier at the snout, which surged. It is worth noting that surge-type glaciers, which account for about 4% of all glaciers (although Hubbard Glacier is not one of them), actually recede and advance cyclically over decades for internal mechanical reasons that are almost completely decoupled from climate. One cannot draw climatic inferences from the current state of such glaciers.


Fig 1 Generalised global palaeotemperature curve derived from the isotopic signature of marine sediments for the last 80 million years, showing a general cooling, with projected temperature rises for the next 100 years based on IPCC scenarios.

Current and future cryospheric change


In contrast to the message portrayed by Ollier, extensive scientific evidence indicates that ice masses are in fact melting at rates that far exceed background trends and this is happening in nearly all glacierised (glacier-covered) regions on Earth. These changes are already reducing certain water supplies, increasing the rate of global sea-level rise, influencing ocean circulation, changing ecosystems and generating new hazards.
The East Antarctic Ice Sheet has the potential to raise sea levels by ~60 m, but the available evidence shows that it is the most stable of Earth’s ice sheets, as losses at the periphery appear to be roughly compensated by snowfall in the interior24. This stable state stands in marked contrast to the increasing losses occurring from West Antarctica where annual ice losses are estimated to be >100 Gigatons per year, which is equivalent to c.0.3mm per year of sea-level rise, with a potential total contribution of c. 3.3 m sea-level rise25. The Antarctic Peninsula ice sheet is also losing mass at a relatively high rate of 25 Gigatons per year11.

In the northern hemisphere, the Greenland ice sheet, which could potentially contribute ~7m to sea-level rise, has been experiencing both increasing discharge velocities and mass loss over the past decade3. The area of the ice sheet experiencing surface melt increased by ~30% between 1979 and 2008. Furthermore, recent data indicate equivalent loss of ice from accelerated ice flow into the ocean, more than compensating for the measured increase in accumulation in the interior of the ice sheet. These losses are mirrored by very large reductions in sea ice cover in the Arctic Ocean26. It is obviously important to examine the role of natural and regional climate fluctuations, but these appear to be secondary to global warming27.

Taken together, rigorous net mass-budget accounting for the Greenland and Antarctic Ice Sheets indicates that they are currently losing mass at a rate of at least 330 Gigatons of ice per year and this includes accumulation gains in their interior from enhanced precipitation in a warmer climate2,11. This is in good agreement with satellite detection of gravity, which shows ice sheet losses of at least 370 Gigatons per year. The actual losses may be as high as 500 Gigatons per year according to both methods and this is equivalent ot c.1.5 mm of sea-level rise per year.

Outside the polar ice sheets, glaciers around the world are shrinking at an even more dramatic rate, with the largest mass losses per unit area being in the European Alps, Patagonia and NW parts of America. In the European Alps, glaciers experienced marked advances during the so-called Little Ice Age, culminating in ~1850. The subsequent recession is evident not only from kilometres of ice-frontal retreat, but also tens to 100+ metres of thinning of glacier tongues. Similar trends have been reported throughout the Western Cordillera of North America. For example 98% of glaciers monitored there are receding, although there are anomalous exceptions like the Hubbard Glacier (as mentioned above).

The Himalayan region (Fig. 4) and the tropical Andes are characterised by down-wasting and recession behind potentially unstable moraine dams which pose an additional threat – that of outburst lake flooding. The Himalaya have been the focus of recent media attention since the correct identification of an erroneous statement in chapter 10.6 of the contribution by Working Group II to the IPCC 200728 report that glaciers would disappear by 2035. Monitoring of this region has been poor because of its inaccessibility, but apart from a few notable exceptions in the Karakorum, satellite imagery clearly shows that most glaciers are losing mass.

The World Glacier Monitoring Service regularly summarises all glacier mass balance and ice-margin positional data from around the world. So far their data-base consists of 36,000 length change observations from 1800 glaciers, reflecting changes since the Little Ice Age, and 3400 mass balance measurements on 230 glaciers reflecting changes since the mid-20th century. These data show that glaciers have been shrinking worldwide, except for short-lived periods of stability and advance in the 1920s and 1970s. Today, the trend is one of rapid and accelerating recession, and deglaciation of many mountain ranges is likely in the coming decades29.

The impact of this glacier melting on rising sea level is proving to be more extreme than predicted by Working Group 1 of the IPCC30. From 1993 to 2007 global sea level rose 3-4 mm per year, double the 1.7 mm average recorded over the 20th century. Melting of land ice has become the dominant contributor to sea-level rise, exceeding that caused by the thermal expansion of the oceans. Sea level projections from the IPCC30 now appear to be underestimates31.

It is a fact that the overwhelming majority of the Earth’s ice masses are shrinking and receding, probably at an accelerating rate, and well beyond the influence of natural climate fluctuations such as the Little Ice Age.  Reconstructions of past climate and ice-mass volume from ice core records indicate that global temperature during the last interglacial period was 2-3°C warmer than at present and that sea-levels were 4-6 m higher than present30. From a range of models, the IPCC30 (p.13) has predicted best-estimate global warming scenarios ranging from 1.8°C (‘likely range’ 1.1-2.9°C) to 4.0°C (‘likely range’ 2.4-6.4°C) by the end of the century, with amplification of these values in the Polar Regions.

At the lower end of the spectrum the emission scenario (B1) is based on mid-century population peak, change of economic structures and the introduction of clean and resource efficient technologies, whereas at the upper end of the spectrum (scenario A1F1) it is ‘business as usual’ with continued reliance on fossil fuels. The last time global temperatures were sustained at the 4oC or higher level than that of today for hundreds of thousands of years or more was in pre-Oligocene time, prior to the formation of all of the world’s ice sheets (Fig. 1).


Fig. 7. Large supraglacial stream on the surface of the Greenland Ice Sheet. Photo: Alun Hubbard

Coda


Ollier argues that ice sheets are inherently stable (1) because current patterns of flow are unrelated to modern climate, (2) because basal lubrication is not important, (3) because meltwater does not form on the surface of ice sheets, and (4) because iceberg calving dynamics do not influence the interior of ice sheets. Above we have explained why each of these assumptions is incorrect.

The article we respond to is not new. An almost identical article was published in 2007 on the website of the Frontiers of Freedom Institute in the USA (http://ff.org) and in 2009 in the Quarterly Newsletter of the Australian Institute of Geoscientists (http://aig.org.au/newsletters). Seeking multiple publications of near identical articles is uncommon practice in science. By appearing in Geoscientist in 2010, we feel it has become necessary to refute the misconceptions in Ollier’s article clearly.

Acknowledgements


We thank David Vaughan for general advice and reviewing an earlier version of this manuscript.


References and further reading


This article does not pretend to be a comprehensive review of the points of view raised by Ollier1, but it draws on a range of peer-reviewed materials that are based on credible science. As background, for a comprehensive understanding of glaciology, Paterson’s classic Physics of Glaciers33 is a ‘must-read’ treatise; for an up-to-date synthesis on glacial processes the textbook by Bennett and Glasser34 is a good starting point; and for an account directed at the layperson there is the photography-based book by Hambrey and Alean35. A recent UNEP-sponsored report of the World Glacier Monitoring Service demonstrates clearly the response of glaciers to climate change worldwide, through a synthesises all the available data from mountain glaciers and ice caps29. In addition, the IPCC (2007)30 report summarises the state of knowledge concerning the cryosphere and discusses the limitations of the data and uncertainties in considerable depth. The references cited by Ollier1 are also worth reading, in particular to consider whether or not they are ‘alarmist’, as he states.
  1. Ollier, C 2010. Glaciers – science and nonsense. Geoscientist, 20(3), 16-21
  2. Rignot, E 2008. Changes in West Antarctic ice stream dynamics observed with ALOS PALSAR data. Geophysical Research Letters 35, L12505, doi:10.1029/2008GL033365.
  3. Van den Broeke, M, Bamber, J, Ettema, J, Rignot, E, Schrama, E, van de Berg, W J, van Meijgaard, E, Velicogna, I, Wouters, B 2009. Partitioning recent Greenland mass loss. Science 326, 984-986.
  4. Joughin, I, Das, S B, King, M A, Smith, B E, Howat, I M, Moon, T 2008. Seasonal speedup along the western flank of the Greenland Ice Sheet. Science 320, 781, doi: 10.1126/science.1153288.
  5. van de Wal, R S W, Boot, W, van den Broeke, M R, Smeets, C, Reijmer, C H, Donker, J J A, Oerlemans, J 2008. Large and rapid melt-induced velocity changes in the ablation zone of the Greenland Ice Sheet. Science 321, 111-113.
  6. Hubbard, A, Shepherd, A, Nienow, P, Joughin, I, King, M, McMillan, M, Box, J, Mair, D 2008. Seasonal and diurnal melt-induced flow dynamics at a land terminating outlet of the Greenland Ice Sheet. AGU abstract #C31C-0520, 2008AGUFM.C31C0520H.
  7. Shepherd, A, Hubbard, A, Nienow, P, King, M, McMillan, M, Joughin, I 2009. Greenland ice sheet motion coupled with daily melting in late summer. Geophysical Research Letters 36, doi:10.1029/2008GL035758.
  8. Das, S B, Joughin, I, Behn, M D, Howat, I M, King, M A, Lizarralde, D, Bhatia, M P 2008. Fracture propagation to the base of the Greenland Ice Sheet during supraglacial lake drainage. Science 320, 778-781.
  9. Scott, J T B, Gudmundsson, G H, Smith, A M, Bingham, R G, Pritchard, H D, Increased rate of acceleration on Pine Island Glacier strongly coupled to changes in gravitational driving stress, The Cryosphere, 3, 125–131, 2009.
  10. Rignot, E, Kanagaratnam, P 2006. Changes in the velocity structure of the Greenland ice sheet, Science. 311, 986-990.
  11. Howat I M, Joughin, I, Fahnestock, M, Smith, B E, Scambos, T A 2008. Synchronous retreat and acceleration of southeast Greenland outlet glaciers 2000-06: ice dynamics and coupling to climate. Journal of Glaciology 54, 646-660.
  12. Holland, D M, Thomas, R H, de Young, B, Ribergaard, M H, Lyberth, B 2008. Acceleration of Jakobshavn Isbrae triggered by warm subsurface ocean waters. Nature Geoscience 1, 659-664.
  13. Cook, A J, Vaughan, D G, 2010. Overview of areal changes of the ice shelves on the Antarctic Peninsula over the past 50 years. The Cryosphere 4, 77-98.
  14. Rignot, E, Bamber, J, van den Broeke, R, Davis,C, Li, Y, van de Berg, W & van Meijgaard, E 2008. Recent Antarctic ice mass loss from radar interferometry and regional climate modelling. Nature Geoscience 1, 106 – 110, doi:10.1038/ngeo102
  15. Pritchard, H D, Vaughan, D G 2007. Widespread acceleration of tidewater glaciers on the Antarctic Peninsula. Journal of Geophysical Research 112, F03S29, doi:10.1029/2006JF000597.
  16. Pritchard, H D, Arthern, R J, Vaughan, D G, Edwards, L A 2009. Extensive dynamic thinning on the margins of the Greenland and Antarctic ice sheets. Nature 461, 971-975
  17. Rignot, E, Casassa, G, Gogineni, P, Krabill, W, Rivera, A, Thomas, R 2004. Accelerated ice discharge from the Antarctic Peninsula following the collapse of the Larsen B Ice Shelf. Geophysical Research Letters, 31, L18401. (doi:10.1029/2004GL020697).
  18. Scambos, T A, Bohlander, J A, Shuman, C A, Skvarca, P 2004. Glacier acceleration and thinning after ice shelf collapse in the Larsen B embayment, Antarctica. Geophysical Research Letters, 31, L18402. (doi:10.1029/2004GL020670).
  19. St. John, K E K, Krissek, L A 2002. The late Miocene to Pleistocene ice-rafting history of southeast Greenland. Boreas 31, 28-35.
  20. Kopp, R E, Simons, F J, Mitrovica, J X, Maloof, A C, Oppenheimer, M 2009. Probabilistic assessment of sea level during the last interglacial stage. Nature 462, 863-867.
  21. Naish, T, Powell, R, Levy, R and 53 others 2009. Obliquity-paced Pliocene West Antarctic ice Sheet oscillations. Nature 458, 322-328.
  22. Turcotte, D L, Schubert, G 2002. Geodynamics, 2nd edition. Cambridge University Press, Cambridge, 472 pp.
  23. Molnia, B F 2007. Late nineteenth to early twenty-first century behaviour of Alaskan glaciers as indicators of changing regional climate. Global and Planetary Change 56, 23-56.
  24. Davis, C H, Li, Y, McConnell, J R, Frey, M M, Hanna, E 2005. Snow-driven growth in East Antarctica ice-sheet mitigates recent sea level rise. Science 308, 1898-1901.
  25. Bamber, J L, Riva, R E M, Vermeersen, B L A, LeBrocq, A M 2009. Reassessment of the Potential Sea-Level Rise from a Collapse of the West Antarctic Ice Sheet. Science 324, 901-903.10.1029/2007GL029703.
  26. Stroeve, J, Holland, M, Meier, W, Scambos,T, Serreze, M 2007. Arctic sea ice decline: faster than forecast. Geophysical Research Letters 34, L09501, doi:
  27. Hanna, E, Huybrechts, P, STeffan, K, Cappelen, J, Huff, R, Shuman, C, Irvine-Flynn, T, Wise, S, Griffiths, M 2008. Increased runoff from melt from the Greenland Ice Sheet: a response to global warming. Journal of Climate 21, 331-341.
  28. Cruz, R V, Harasawa, H, Lal, M, Wu, S, Anokhin, Y, Punsalmaa, B, Honda,Y, Jafari, M, Li, C, Huu Ninh, N. 2007. Asia. Climate Change 2007: Impacts, adaptation and vulnerability. Contribution of Working Group II to the Fourth Assessment Report of the Intergovernmental Panel on Climate Change. In Parry, M L, Canziani, O F, Palutikof, J P, van der Linden, P J, Hanson, C E (Eds.), Cambridge University Press, Cambridge, pp. 469-506.
  29. Zemp, M, van Woerden, J (eds.) 2009. Global glacier changes: facts and figures. The United Nations Environment Programme and World Glacier Monitoring Service, Zurich, 88 pp.
  30. IPCC 2007. Climate change: the physical science basis. Cambridge University Press, Cambridge, 1054pp.
  31. Grinsted, A, Moore, J C, Jevrejeva, S 2010. Reconstructing sea level from paleo and projected temperatures 200 to 2100 AD. Climate Dynamics 34, 461-472.
  32. Chapman, W L, Walsh, J E 2007. Simulations of Arctic temperature and pressure by global coupled models. Journal of Climate 20, 609-632.
  33. Paterson, W S B 1994. The Physics of Glaciers, Third Edition.Pergamon, Oxfod, 480 pp.
  34. Bennett, M R, Glasser, N F 2009. Glacial geology: ice sheets and landforms, 2nd edition. John Wiley & Sons, Chichester, 385 pp.
  35. Hambrey, M J, Alean, J 2004. Glaciers, 2nd edition. Cambridge University Press, Cambridge, 345pp.
  36. Barrett, P J 2003. Cooling a continent. Nature, 421, 221-223.

Author affiliations

  1. Centre for Glaciology, Aberystwyth University
  2. Bristol Glaciology Centre, Bristol University
  3. Scott Polar Research Institute, University of Cambridge
  4. British Antarctic Survey, Cambridge