Product has been added to the basket

Online Special - Rock & ice: Eyjafjallajökull and Climate Change

News and Views from AGU Fall Meeting 2010, by Fabian B. Wadsworth*


Geoscientist Online Special 21.03 April 2011


Volcanic activity could increase in volume and frequency over the next centuries as a result of receding volumes of ice on the Earth’s surface. Because volcanoes occur both at high altitudes (e.g. New Zealand, Andean mountains) and high latitudes (e.g. Iceland, Antarctica), ice and volcanic craters often come hand-in-hand. The American Geophysical Union’s Fall Meeting in December 2010 hosted hundreds of presentations on volcanology research associated with glaciated volcanoes as well as dedicating a day of seminars to understanding the mid-2010 eruption of the ice-capped Eyjafjallajökull volcano, Iceland. This event taught scientists more about the way ice and magma interact and about the damage that sustained eruptions can have upon society, as well as informing the growing community who dedicate themselves to understanding the volcanic contribution to our warming Earth.


Introduction: Understanding volcano-ice interaction


Ice and volcanoes are contiguous in many active places on Earth due to either high altitude (>4000m ) or latitude. They interact in some key ways with results critical to climate. Mounting evidence suggests that volcanic eruptions can occur as a result of unloading ice from a volcano. In the geological record there is correlation between warming climates and the frequency of volcanic eruptions( )(Fig. 4b). Broadly speaking, this is because unloading the mass of an ice sheet by melting and draining causes hot rock to rise buoyantly into the base of a volcano. Alarmingly, much of the ice-sheet mass on volcanoes is currently receding due to climate warming( )(i).

Hot lava flows, gases and pyroclastic material emplaced on or beneath glacial ice can melt ice rapidly. The draining melt water can cause catastrophic sediment-bearing floods, known as jökulhlaups and lahars around the volcano. These can be very hazardous (e.g. Cotopaxi, Ecuador 1877 eruption( )), especially if water is dammed and released suddenly. These hazards occurred during the Eyjafjallajökull eruption.

Eruptions of any type can become explosive if water comes into contact with magma so ice-capped volcanoes tend to erupt explosively. Thinning of ice sheets on volcanoes is predicted to promote explosive eruptions(i). Alternatively, if an eruption occurs below a glacier, the ice may suppress the distribution of ash or lava; however this is only known to occur at volcanoes covered by substantial thick ice sheets (e.g. Katla). Generally, ice exacerbates many of the physical hazards associated with volcanic activity.


Figure 1 A) The location of Eyjafjallajökull and the south-east volcanic zone on Iceland. NA=North American plate, EU=European plate. Average annual plate velocities shown. Satellite image shows the ash plume on April 17th, 2010.

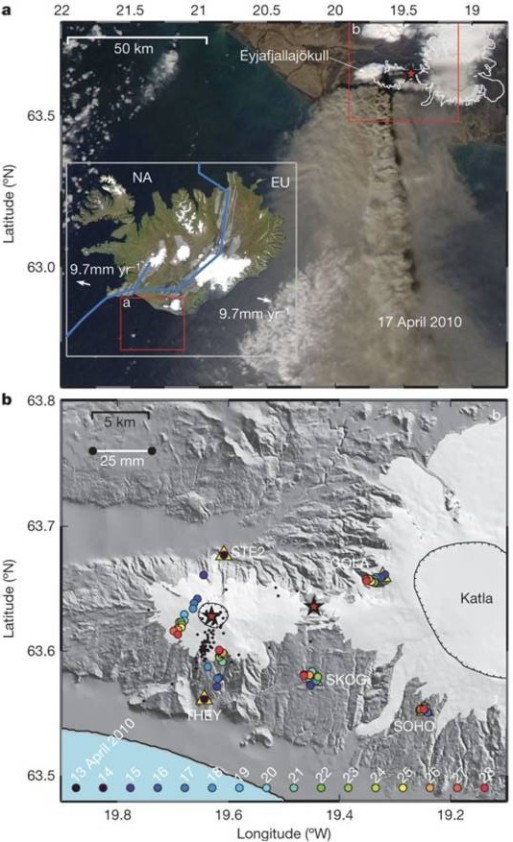
Figure 1 - A) The location of Eyjafjallajökull and the south-east volcanic zone on Iceland. NA=North American plate, EU=European plate. Average annual plate velocities shown. Satellite image shows the ash plume on April 17th, 2010.  B) Displacement foci and magnitude measured using synthesis of geodetic and seismic studies. (Sigmundsson et al. 2010(vii))


Eyjafjallajökull and its icy top in 2010


Iceland is a good place to learn about volcano-ice interactions. Eyjafjallajökull is a sub-glacial volcano in the south-east arm of Iceland’s volcanic zone (Fig. 1). Its 2010 eruptions not only stopped much of Europe’s air-traffic but also brought the hazards of volcano-ice interaction and the importance of volcanology in the management of these hazards to the forefront of public and commercial attention.

About 250m of ice cover Eyjafjallajökull’s summit( ). The neighbouring larger volcano, Katla (25km to the east), is capped by the thicker Mýrdalsjökull glacier( ) (see Fig. 1). The climactic April 14th (2010) Eyjafjallajökull eruption began with effusion of basalt lava flows to the east of the summit, and it evolved into a prolonged (mid-April to mid-May) explosive eruption of intermediate (trachyandesite) magma. This followed 18 years of intermittent volcanic unrest and nearly 200 years of quiescence(vii). Critically, the “explosivity [was] amplified by magma-ice interaction,”( ) resulting in large volumes of ash.

Geodetic and seismic studies reveal that between 1994 and 2010, a complex set of four magmas accumulated at 3km and rose to 2km below the surface of Eyjafjallajökull(vii)( ). It is from these intrusions (sills) that magma broke to the surface on April 14th, 2010. Similar studies at Katla were less conclusive because the succession of sub-glacial eruptions have melted the ice cap from beneath (such as in 1999 ) and reduce the accuracy of depth estimates. The ice on Katla has historically always been dynamic, playing host to many sub-glacial eruptions that produce variable jökulhlaups and challenge hazard assessment organisations. There was no resultant eruption from Katla in 2010 and the nature of a link between Eyjafjallajökull and Katla is enigmatic, but the hazards due to volcano-ice interaction at Katla are thought to be far larger than what we saw last year from its smaller sibling(vii). It seems that ice can hinder the methods scientists employ to understand and predict what’s going on beneath.

Figure 2 – The view of Eyjafjallajökull from the north on May 4th, 2010 showing the eruption shift from effusive to explosive styles. Ref: IAVCEI

Figure 2 – The view of Eyjafjallajökull from the north on May 4th, 2010 showing the eruption shift from effusive to explosive styles. Ref: IAVCEI


Eyjafjallajökull: eruption 2010


  1. March 20th, 2010  Start of eruption. Non-explosive activity. Basaltic lavas flowed from a fissure on the ice-free flank of the volcano. Little SO2 was released.
  2. April 15th-19th, 2010 The vent migrated to the summit, where interaction with ice (250m melted in 4 hours) became explosive, producing lots of ash. SO2 emissions remained low, possibly because SO2 was initially sequestered (dissolved) into the glacial melt water.
  3. April 20th – May 3rd, 2010.  A small lava flow was erupted the northern part of the glacier, melting ice at ~100m3.s-1 sufficient to form a 150m deep ice depression at the surface. This reduced explosivity and, consequently, the SO2 flux. Little explosive ice interaction occurred at the summit as the ice melted and there is no record of SO2 sequestration into melt water by this time.
  4. May 4th – May 18th, 2010. The most vigorous explosive phase began, producing >30 kilotons of SO2 (total, see Fig. 3), 150 kilotons of CO2 and a huge volume of ash in a 10km high ash plume that stratospheric winds carried across major European air traffic routes.
  5. May 19th – May 24th, 2010  The eruption waned and the plume gradually declined. Volcanic gas emissions slowed until the eruption stopped.
Figure 3 – A) The cumulative SO2 emission and broad eruption sequence synthesised from data by Carn et al. (2010)(x) acquired by OMI (NASA). Ash cloud data from Schlager et al. (2010). Note that the ash cloud concentration drops (and the SO2 line s

Figure 3 – A) The cumulative SO2 emission and broad eruption sequence synthesised from data by Carn et al. (2010)(x) acquired by OMI (NASA). Ash cloud data from Schlager et al. (2010). Note that the ash cloud concentration drops (and the SO2 line shallows) as SO2 sequestration in melt-water occurs between days 30 and 40 after the beginning of the eruption. B) An example of an SO2 concentration map (measured at 5km in the plume on May 10th). The highest concentration is in the plume head. Ref: A) Carn et al. (2010), Schlager et al. (2010). B) IAVCEI

Eyjafjallajökull and Climate


Ice-magma interactions at the summit of Eyjafjallajökull not only affected the hazards and explosivity of the eruption but also have implications for how volcanoes and climate may interact. Volcanic gas emissions are known to contribute to the greenhouse effect( ). SO2, CO2, CO and to a lesser extent, HCl and HF have been measured at Eyjafjallajökull in 2010(vii)( ), all of which can reduce ozone aerosol. Data from the Ozone Monitoring Instrument (OMI; mounted on NASA’s AURA satellite) presented at the AGU Fall Meeting report volcanic SO2 concentrations as representative of all volcanic gas emissions (see Fig. 3 for a synthesis of these data). OMI recorded a depleted ozone aerosol concentration in the plume immediately following the May 4th explosivity, suggesting that the climate forcing effects were significant( ). The effects of sequestration in melt water are negligible given prolonged eruption (throughout May the SO2 flux was high) because the ice recedes around the summit, removing the melt water from the proximity of the gas and ash plume. Therefore, whilst ice-magma interaction is sometimes seen to change the character of an eruption, the ice-gas interaction does not continually surpress the climate impacts of long-timescale volcanic events.

The climate warming effects of volcanoes, directly due to emission of volcanic greenhouse gases, is well documented(e.g.xi). The Earth’s largest eruptions are broadly correlated with the Earth’s biggest biological disasters (mass extinctions)( ). The onset of activity at the Iceland hotspot (~55 million years ago), when eruptions in the North Atlantic were more frequent than today, is postulated to be contigious with global warming at that time (the Palaeocene-Eocene Thermal Maximum or PETM)( ). As discussed, global warming that results in ice-sheet recession can increase net frequency of volcanic eruptions globally, thus establishing a positive feedback mechanism whereby the equilibrium is lost and global warming becomes ever more rapid.


Figure 4 – A) Global data set for SO2 flux during eruptions (tons per day) annotated with the occurrence of ice or snow interaction(xi). B) The correlation between prehistoric deglaciation and frequency of volcanic activity (for the last 400 k.y.).

Figure 4 – A) Global data set for SO2 flux during eruptions (tons per day) annotated with the occurrence of ice or snow interaction(xi). B) The correlation between prehistoric deglaciation and frequency of volcanic activity (for the last 400 k.y.). Filled circles represent eruptions, which correlate with peaks in the SPECMAP δ18O curve, representing global ice( ). Ref: A) Halmer et al. (2002). B) Jellinek et al. (2004).

Eyjafjallajökull in perspective: a global comparison


Comparing the observations of Eyjafjallajökull in 2010 to other studied eruptions around the world allows us to qualify the significance of ice in the SO2 story. Correlations between periods of ice recession and volcanic activity over the last 400,000 years (Fig. 4b) possibly indicate that removal of ice can directly lead to eruption, but many of the factors affecting this link remain poorly understood. Today many volcano ice-caps are receding. Cotopaxi in Ecuador suffers 3-4m ice recession per year( ); Popocatepetl has lost 4m per year since 1999( ) (very high SO2 flux; Fig 4a) and Vatnajökull, also on Iceland, loses 0.8m of permanent glacial ice thickness per year( ). Kilimanjaro is almost completely ice-free in summer( ). All of these figures have accelerated since the mid-1990s(i).

Many of the volcanoes with the highest SO2 flux (Fig. 4a) are partially ice covered. Eyjafjallajökull is not unique and, although the 2010 eruption was devastating to the transport and tourism industry across Europe, ice interaction in highly volatile (gas-rich, shown by SO2 flux) volcanoes around the world have the combination of factors for hazardous explosivity. Sequestration of SO2 into melt-water, though possibly an initial SO2 sink during last year’s Eyjafjallajökull eruption, is unlikely to significantly negate the gas emissions from volcanoes that affect our climate.


The future of ice-capped volcanoes

  1. Climate warming in the geological record and today is known to reduce global ice volume. Removal of ice from volcanoes will change the way they behave. Eruptions can become more frequent due to unloading of the volcano, which potentially exacerbates climate warming and ice removal in a positive feedback loop. Further research is required to identify the factors affecting this feedback.
  2. Increasing volcanic and geothermal activity in the run up to an eruption will locally accelerate ice volume loss.
  3. Hazards associated with volcanoes and eruption explosivity can be more catastrophic at ice- and snow-capped volcanoes. However, as an eruption melts the ice, the risk of lahars and floods by melt-water interaction is reduced and the ice-magma affect on explosivity is less.
  4. SO2 flux during sub-glacial, short-lived or small volume eruptions can possibly be sequestered into ice-derived melt water.

The future for volcanologists studying ice-magma interaction


One third of people in Britain, and more Americans, believe that scientists exaggerate the severity of climate change today( ). The need for volcanology to contribute understanding is paramount. The Fall Meeting of AGU featured the presentation of new satellite and remote sensing techniques for measuring gas fluxes from volcanoes (e.g. improved COSPEC and OMI technologies), ice sheet thicknesses (by radar), sub-surface magma movement monitoring (by InSAR, GPS and seismic) and new ideas for calculating ice-recession and its effect on eruptions. The future of ice-volcano research will need to better constrain the factors affecting the relationship between unloading ice and volcanic eruption. By documenting sub-glacially erupted successions and comparing them with contemporaneous ice-thickness predictions, we can build a picture of ice-eruption interplay at a single volcano. Already, scientists at the AGU have compared events from the Eyjafjallajökull eruption in 2010 to improve hazard awareness elsewhere( ) but there are more lessons to be learned.

Want to learn more about Eyjafjallajökull?

For OMI near real time SO2 for the Northern Hemisphere:
For OMI SO2 subsets for Iceland:
For London Volcanic Ash Advisory Committee information:
For webcams on Iceland volcanoes:

For press release about Ejyafjallajokull and science:

Acknowlegments


Many thanks to Dr Mike Branney and Prof. John Smellie for constructive comments, to Prof. Mike Petterson for encouragement.

* Contact: University of Leicester Department of Geology University Road, Leicester LE1 7RH Fbw1@lle.ac.uk

References

  1. Tuffen, H. 2010. How will melting of ice affect volcanic hazards in the twenty-first century? Phil. Trans. R. Soc. 368. 2535-2558. See references therein for examples of ice recession on volcanoes given on page 4.
  2. Huybers, P., Langmuir, C. 2009. Feedback between deglaciation, volcanism and atmospheric CO2. Earth Planet Sci. Lett. 286. 479-491.
  3. V1uille, M., Francou, B., Wagnon, P., Juen, I., Kaser, G., Mark, B.G., Bradley, R.S. 2008. Climate change and tropical Andean glaciers – past, present and future. Earth Sci. Rev. 89. 79-96.
  4. Major, J.J., Newhall, C.G. 1989. Snow and ice perturbation during historical eruptions and the formation of lahars and floods. Bull. Volcanol. 52. 1-27.
  5. Gudmundsson, M.T., Magnusson, E., Hognadottir, T., Oddsson, B., Roberts, M.J., Sigurdsson, O., Johannesson, T., Hoskuldsson, F. 2010. Volcano-ice interaction during the April-May 2010 eruptions of Eyjafjallajökull, Iceland. Abstract NH13C-01 presented at 2010 Fall Meeting, AGU, San Francisco, Calif., 13-17 Dec.
  6. Sturkell, E., Einarsson, P., Roberts, M.J., Geirsson, H., Gudmundsson, M.T., Sigmundsson, F., Pinel, V., Gudmundsson, G.B., Olafsson, H., Stefansson, R. 2008. Seismic and geodetic insights into magma accumulation at Katla subglacial volcano, Iceland: 1999-2005. J. Geophys. Res. 113.
  7. Sigmundsson, F., Hreinsdóttir, S., Hooper, A., Aranadóttir, T., Pederson, R., Roberts, M.J., Oskarsson, N., Auriac, A., Decriem, J., Einarsson, P., Geirsson, H., Hensch, M., Ofeigsson, B.G., Sturkell, E., Sveinbjornsson, H., Feigl, K.L. 2010. Intrusion triggering of the 2010 Eyjafjallajökull explosive eruption. Nature. 468. 426-430.
  8. Tarasewicz, J., Brandsdottir, B., Hensch, M., White, R.S. 2010 Tracking the seismicity preceding and during the March 2010 Fimmvorduhals fissure eruption and April 2010 summit eruption of Eyjafjallajökull, Iceland. Abstract V33C presented at 2010 Fall Meeting, AGU, San Francisco, Calif., 13-17 Dec.
  9. Einarsson, P., Hjartardóttir, R. 2010. Structure and tectonic position of the Eyjafjallajökull volcano, S-Iceland. Abstract V21F-01 presented at 2010 Fall Meeting, AGU, San Francisco, Calif., 13-17 Dec.
  10. Carn, S.A., Wang, J., Yang, K., Krotkov, N.A. 2010 Sulfur budget of the 2010 Eyjafjallajökull eruption derived from satellite observations. Abstract V53F-08 presented at 2010 Fall Meeting, AGU, San Francisco, Calif. 13-17 Dec.
  11. Halmer, M.M., Schmincke, H.-U., Graf, H.-F. 2002. The annual volcanic gas input into the atmosphere, in particular into the stratosphere: a global data set for the last 100 years. J. Volc. Geoth. Res. 115. 511-528.
  12. Clarisse, L., Prata, F., Clerbaux, C., Hurtmans, D., Coheur, P. 2010. Detecting and quantifying volcanic ash, ice and sulphate aerosols with hyperspectral infrared sounders. Abstract NH51D-02 presented at 2010 Fall Meeting, AGU, San Francisco, Calif. 13-17 Dec.
  13. Allard, P., Burton, M.R., Oskarsson, N., Michel, A., Polacci, M. 2010. Chemistry and fluxes of magmatic gases powering the explosive trachyandesite phase of Eyjafjallajökull eruption: constraints on degassing magma volumes and processes. Abstract V53F-07 presented at Fall Meeting, AGU, San Francisco, Calif. 13-17 Dec
  14. White, R.V., Saunders, A.D. 2005. Volcanism, impact and mass extinctions: incredible or credible coincidences? Lithos. 79. 299-316.
  15. Chalmers, J.A., Larsen, L.M., Pederson, A.K. 1995. Widespread Palaeocene volcanism around the northern North Atlantic and Labrador Sea: evidence for a large, hot, early plume head. J. Geol. Soc. Lond. 152. 965-969.
  16. Jordan, E., Ungerechts, L., Caceres, B., Penafiel, A., Francou, B. 2005. Estimation by photogrammetry of the glacier recession on the Cotopaxi Volcano (Ecuador) detween 1956 and 1997. Hydrological Sciences Journal. 50. 949-961.
  17. Julio-Miranda, P., Delgado-Granados, H., Huggel, C. & Kääb, A. 2008 Impact of the eruptive activity on glacier evolution at Popocatepetl Volcano (Mexico) during 1994–2004. J. Volcanol. Geotherm. Res. 170, 86–98.
  18. Pagli, C. & Sigmundsson, F. 2008 Will present day glacier retreat increase volcanic activity? Stress induced by recent glacier retreat and its effect on magmatism at the Vatnajökull ice cap, Iceland. Geophys. Res. Lett. 35
  19. Thompson, L. G., Brecher, H. H., Mosley-Thompson, E., Hardy, D. R. & Mark, B. G. 2009 Glacier loss on Kilimanjaro continues unabated. Proc. Natl Acad. Sci. USA 106, 19 770–19775
  20. BBC 2 documentary: “Horizon 2010-2011 – Science under attack”
  21. McKay, D., Cashman, K.V. 2010. Interactions between mafic eruptions and glacial snow or ice: implications of the 2010 Eyjafjallajokull, Iceland, eruption for hazard assessments in the central Oregon Cascades. Abstract NH11B-1133.
  22. Einarsson, P., Hjartardóttir, R. 2010. Structure and tectonic position of the Eyjafjallajökull volcano, S-Iceland. Abstract V21F-01 presented at 2010 Fall Meeting, AGU, San Francisco, Calif., 13-17 Dec.
  23. Hjaltadottir, S., Vogfjord, K.S. 2010. Seismic evidence of magma transport in Eyjafjallajökull during 2009-2010. Abstract V21F-02 presented at 2010 Fall Meeting, AGU, San Francisco, Calif., 13-17 Dec.
  24. Sappho. “Earth” in: The Complete Poems of Sappho. Translated by Willis Barnstone. 2009. Shambhala Publications Inc. London. 206pp.
  25. Jellinek, A.M., Manga, M., Saar, M.O. 2004. Did melting glaciers cause volcanic eruptions in eastern California? Probing the mechanics of dike formation. Journal of geophysical research-solid earth. 109.